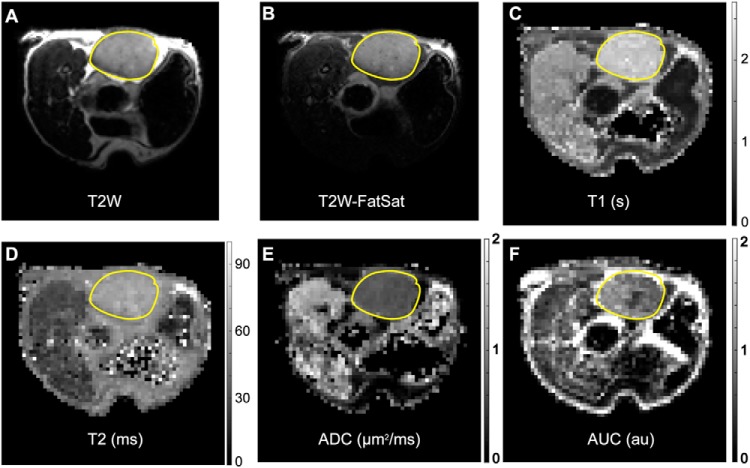
Figure 5.
Representative PDX T2-weighted (T2W) images and magnetic resonance (MR) parametric maps. T2W (A), T2W-FatSat (B), T1 (C), T2 (D), ADC (E), and DCE-AUC (F) parametric maps from a single central slice through a 206-μL tumor. T2W image intensity scaling is arbitrary. Parametric map intensities are given by vertical scale bars. The tumor is outlined with a yellow line. Isolated white or black voxels (specks) generally occur in anatomic regions of very low signal-to-noise ratio (SNR) under the protocol conditions and thus reflect a modeling (parameter estimation) failure. The hyperintense T2W fat signal is a known artifact of the fast spin-echo (FSE) protocol (45–47).

