
Figure 7.
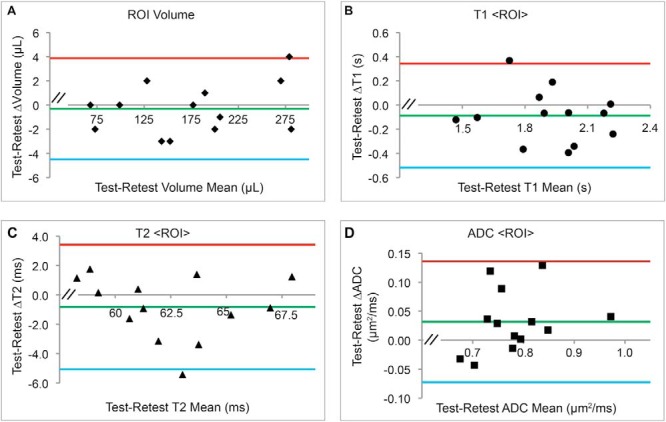
Bland–Altman plots for the test–retest cohort <ROI> Analysis. The <ROI>-determined mean of test and retest parameter values (x-axis) and difference in test and retest parameter values (y-axis) are shown for each tumor (volume (A), T1 (B), T2 (C), ADC (D)), together with overall mean of the test–retest differences (green lines) and 95% confidence limits (red and blue lines). Apparent biases were not statistically significant (P > .05).