
Figure 5.
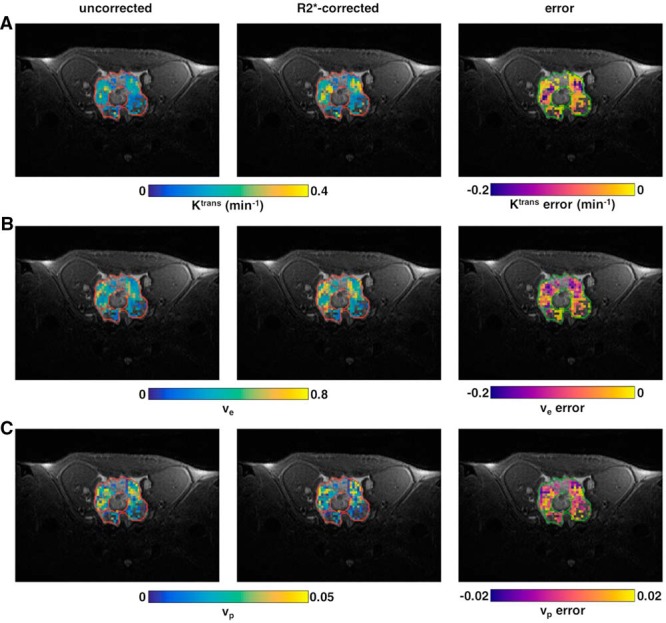
DCE-MRI parametric maps for a TRAMP prostate. Maps of Ktrans (A), ve (B), and vp (C). Each panel shows maps of the uncorrected values (left column), R2*-corrected values (center column), and the error (right column). Maps are overlaid on the high-resolution T2-weighted (T2w) anatomical image. Nonenhancing voxels and voxels where R2* or Tofts model fitting were poor [R2* median R2(t) < 0.75 or R2* minimum R2(t) < 0.5 or Tofts R2 < 0.5] are not shown on the maps.