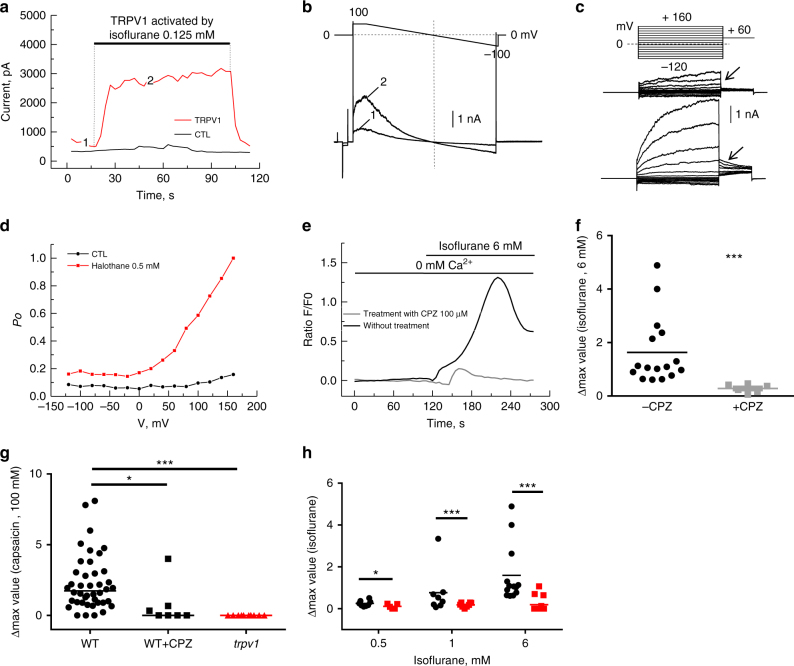
Fig. 1. Volatile anesthetics activate TRPV1 channels heterologously expressed in HEK-293 cells and in flexor digitorum brevis (FDB) isolated fibers.
(a,b) Original recordings of the baseline TRPV1 current (ITRPV1) (acquired at point 1 of the time course in (a)) and isoflurane-activated (0.125 mM) (acquired at point 2 of the time course) in response to pulse protocol with voltage-ramp portion shown above the recordings. Isoflurane activated a membrane current with biophysical properties, such as a prominent outward rectification and close to 0 mV reversal potential, which is similar to the current activated by the established TRPV1 stimulus, capsaicin (data not shown) (n = 7). (c) Examples of the baseline and halothane-activated ITRPV1 in response to the depicted voltage-clamp protocol, which were used to measure voltage dependence of TRPV1 channel open probability (Po in (d); experiments were performed at 20 °C); arrows in (c) point to the ITRPV1 tail currents at + 60 mV. Tail currents were measured during the first millisecond of the final step +60 mV and normalized to the maximal tail current. Normalized amplitude as a function of conditioning depolarizing pulse (ranging from –120 to +160 mV) corresponds to the apparent Po (mean ± S.E.M.,n = 3). Membrane currents were recorded in the whole cell configuration using the Axopatch 200B amplifier (Molecular Devices, Union City, CA). Extracellular solution containing (in mM): 150 NaCl, 1 MgCl2, 5 glucose, 10 HEPES, pH 7.3. Intracellular solution containing (in mM): 150 NaCl, 3 MgCl2, 5 EGTA, 10 HEPES, pH 7.3. (e) Traces show representative curve obtained after stimulation of single fibers with isoflurane (6 mM; black line) or in presence of capsazepine (CPZ; 100 μM; light gray line). (f) Changes in fluorescence ratio F/F0 (peak-resting) induced by drugs as indicated in table above graphs. Capsazepine was added 25 min prior to isoflurane. Corresponding scatterplots of Δ max expressed as median; data are from 16 cells (without CPZ) and 6 cells (with CPZ) from at least 4 independent fibers preparations. Changes in fluorescence ratio F/F0 (peak-resting) induced by (g) capsaicin (100 μM) or by (h) isoflurane (0.5 mM; 1 mM; 6 mM) in C57Bl6J (black) or trpv1−/− mice (red). Corresponding scatterplots of max value expressed as median; for the capsaicin response, data are from 42 cells (wild-type, WT), 7 cells (WT + CPZ), and 10 cells (trpv1−/−) from at least 4 independent fibers preparations. For the isoflurane response, data are from 6 and 5 cells (0.5 mM isoflurane, WT and TRPV1−/− respectively); 9 and 8 cells (1 mM isoflurane, WT and TRPV1−/− respectively); and 12 and 10 cells (6 mM isoflurane, WT and TRPV1−/− respectively) from at least 4 independent fiber preparations. Mann–Whitney tests were used: *p < 0.05, **p < 0.01, ***p < 0.001, ****p < 0.0001

