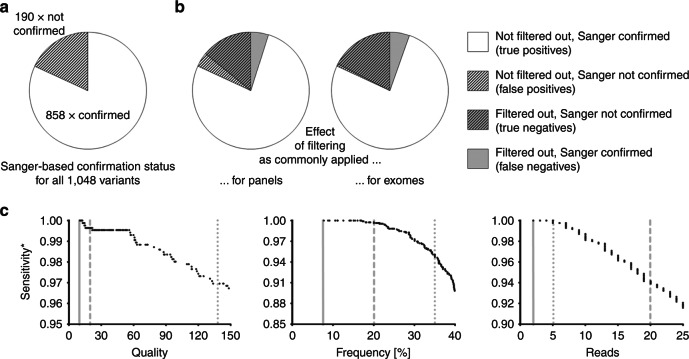
Fig. 1. Performance of filtering criteria commonly used during variant calling in next-generation sequencing (NGS).
a Distribution of Sanger-confirmed vs. Sanger-rejected variants in our data set. b Modeling of the effects of standard panel- and exome sequencing (ES)-associated filtering cutoffs. c Contribution of individual parameters to the drop in sensitivity (stippled and dotted gray lines: common cutoffs for panel-based and ES-based approaches, respectively; solid gray lines: cutoffs initially used by the present study). The asterisk denotes that sensitivity as indicated here is not equivalent to the (unknown) overall sensitivity of the assay, but refers to our set of 1048 Sanger followed-up candidate variants

