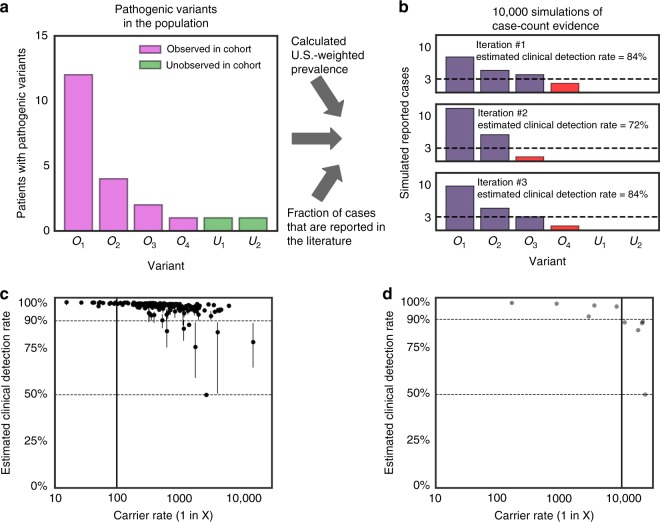
Fig. 5.
Estimation of clinical detection rate. (a, b) A model schematic showing how clinical detection rate is estimated for a hypothetical autosomal recessive (AR) condition. We assume a condition has six pathogenic variants and a carrier rate of 1 in 10,000, resulting in a prevalence of 1 in 400,000,000. (a) Assumed number of pathogenic variants, including both observed variants (purple, variants denoted with O) and a minority of unobserved variants (green, variants denoted with U). (b) Simulations of the expected number of reported cases (assuming all cases will be reported). The estimated clinical detection rate is defined as the sum of the variant frequencies for variants that can be classified as pathogenic, determined by three or more estimated case reports (shown in blue). Variants whose pathogenicity cannot be determined are shown in red or have no reported cases. (c, d) Estimated clinical detection rates for (c) AR conditions and (d) X-linked conditions on the 176-condition panel. US-weighted carrier rates and estimated clinical detection rate for each condition are shown when three reported cases are needed to determine pathogenicity for each variant. Dots show median estimated clinical detection rate from 10,000 iterations per condition, and lines show corresponding 95% confidence intervals. We excluded X-linked severe combined immunodeficiency and X-linked ornithine transcarbamylase deficiency from this analysis because we did not observe any carriers of these X-linked conditions during the study period (see Supplementary Text S3). Conditions and corresponding clinical detection rate estimates are provided in Table S4.

