
Fig. 2.
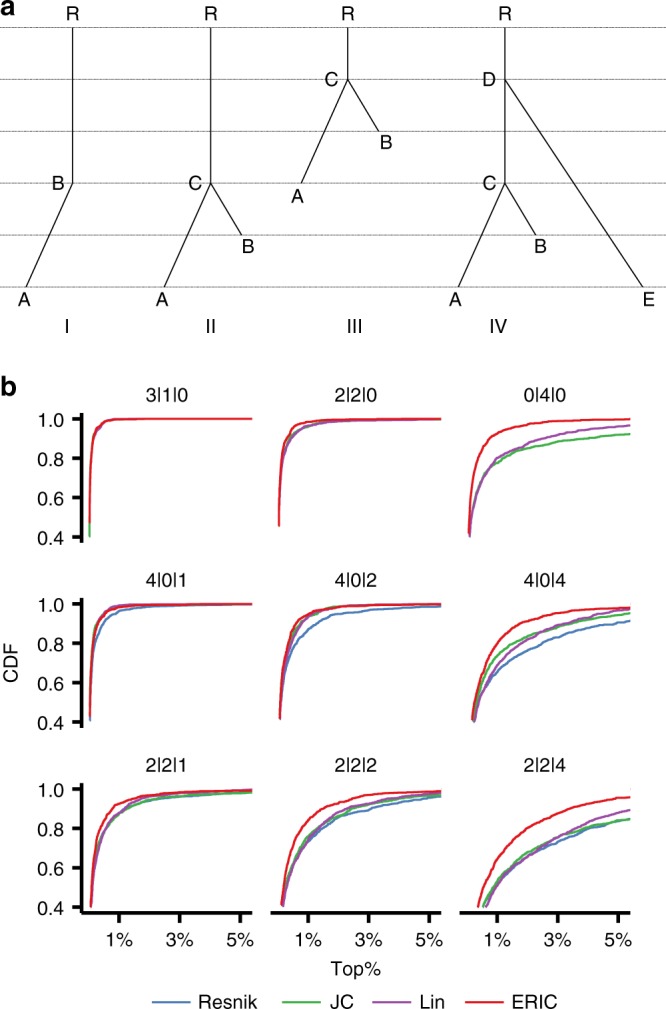
Case illustrations and performance evaluation of Emission-Reception Information Content (ERIC) score. a Case illustrations demonstrating ideas of ERIC score. Four different phenotype cases (I to IV) are shown as examples. A–E are phenotype terms in the phenotype ontology tree, and R is the root. A and B are phenotype terms in comparison. C is the most informative common ancestor (MICA) of phenotypes A and B in cases I, II, and III. In case IV, both phenotypes A and E are far from the outside of the circle with the center of D (the MICA of A and E) and the radius of IC(D), thus E is considered as a noisy phenotype of A by ERIC score. b Performance evaluation of phenotype similarity measures for prioritizing target genes. Resnik, JC, Lin, and ERIC scores were compared. We simulated phenotypes with various imprecision and noise levels, e.g., 2|2|4 represents two true precise phenotypes in the Human Phenotype Ontology (HPO) database, two imprecise phenotypes, and four random noise phenotypes. The top panel represents phenotype sets simulated with imprecision. The middle panel represents phenotype sets simulated with noise. The bottom panel represents phenotype sets with both imprecision and noise. The x-axis is the rank percentile of target genes among 8643 OMIM genes. The y-axis is the cumulative distribution function (CDF) of the rank percentile.