
FIGURE 1.
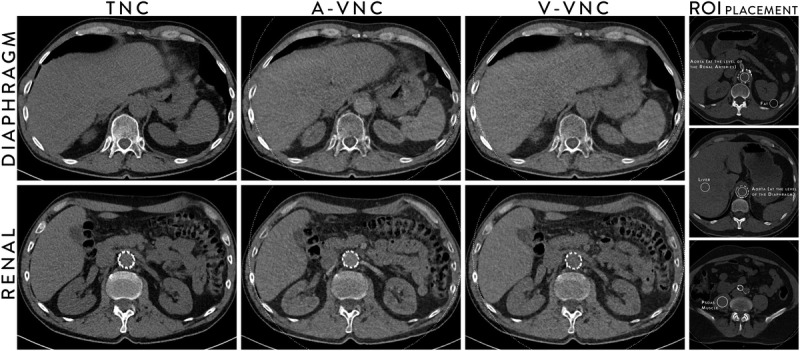
Typical images at the aorta at the level of diaphragm (top row) and aorta at the level of renal arteries (bottom row) for TNC images, VNC images from arterial phase acquisition (A-VNC), and VNC images from venous phase acquisition (V-VNC) and images showing typical examples of the ROI placement (right column).