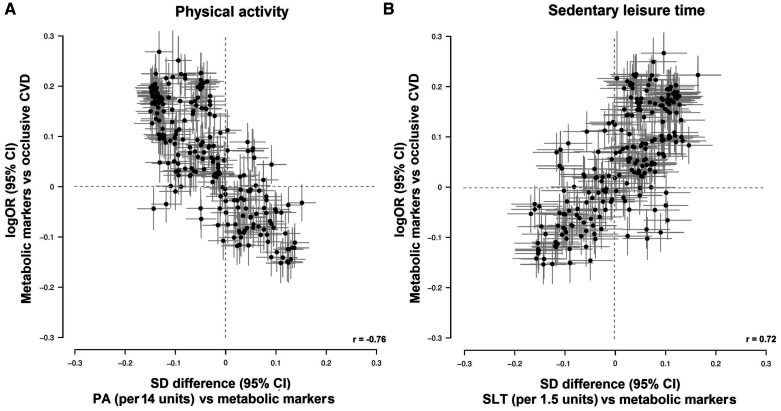
Figure 4.
Global comparison of 1-SD differences of 225 metabolic markers associated with 1-SD higher usual (A) physical activity (PA) and (B) sedentary leisure time (SLT) vs log-odds ratios (ORs) for occlusive cardiovascular disease (CVD) associated with 1-SD higher log-transformed metabolic markers. Estimates on the y axis are the coefficients of logistic regression of occlusive CVD risk (myocardial infarction and ischemic stroke) on log-transformed metabolic markers. Estimates on the x axis are the coefficients of linear regression of log-transformed metabolic markers on (A) total PA and (B) SLT denotes Pearson correlation coefficient.

