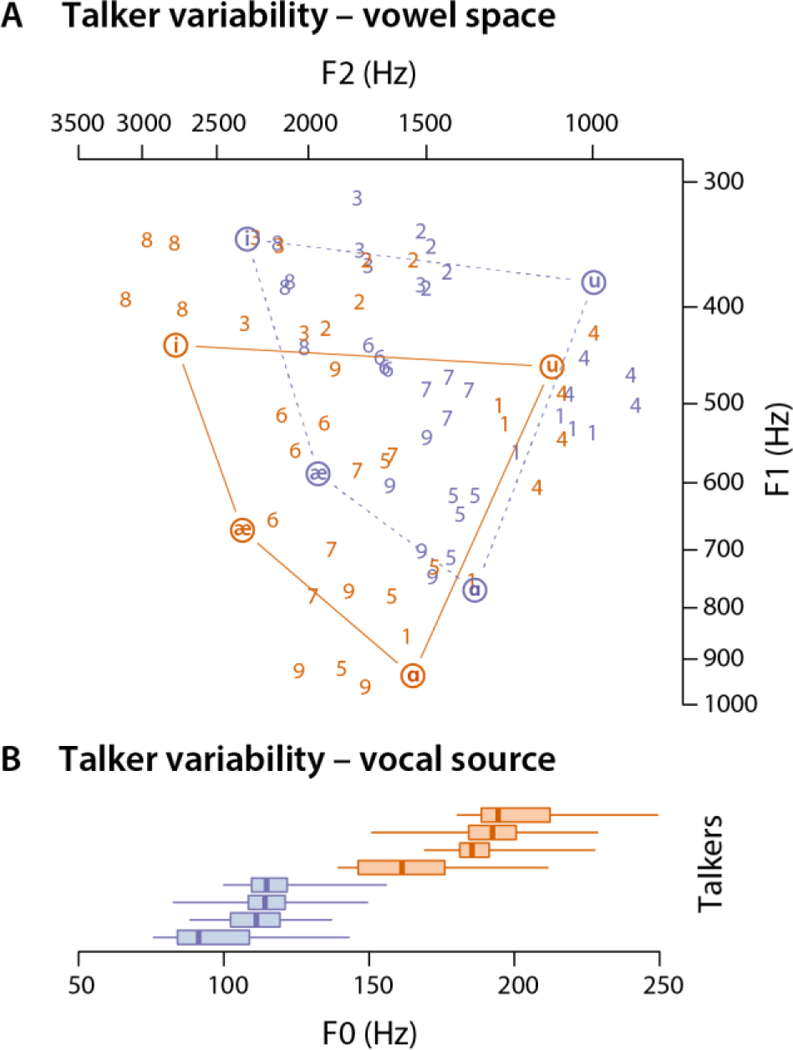
Figure 1.

Acoustic variability of the spoken digit stimuli. (A) The vowel space (first and second formants; F1, × F2; note log scale) of each stimulus. Each point indicates the mean F1 and F2 of the sonorant portion of each stimulus. The digit identity of a stimulus is marked as a number (e.g., 9 = “nine”). Orange and blue colors indicate the four female and four male talkers, respectively. For reference, the acoustic measurements of the current stimuli are situated against the canonical acoustics of the four English point vowels (circled vowels: /i/, /u/, /æ/, and /ɑ/) reported by Hillenbrand et al. (1995). (B) The distribution of vocal pitch (fundamental frequency; F0) of each talker’s digit recordings. F0 was sampled at every 15ms of the sonorant portion of each stimulus. The median, interquartile range, and extrema of the F0 of each talker are displayed.
