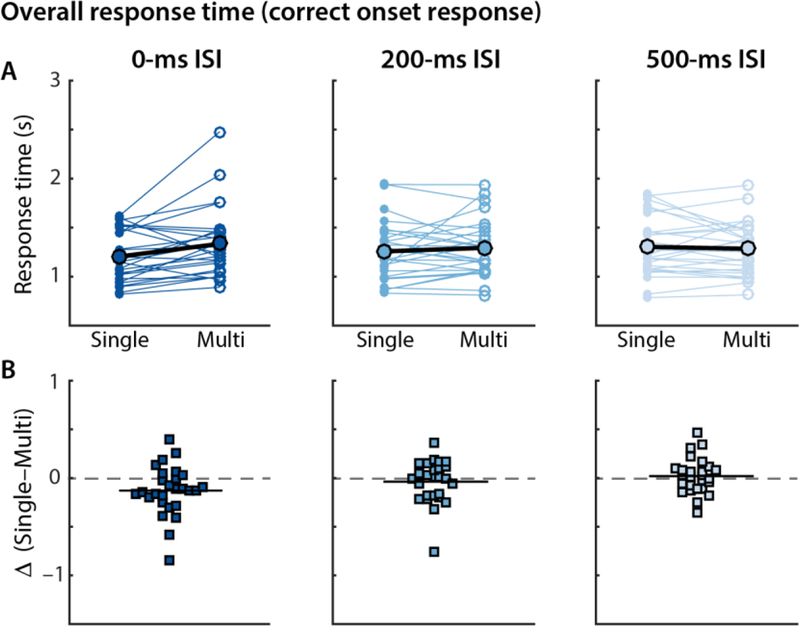
Figure 4.

Response times of the onset of digit sequence recall by talker condition across stimulus presentation rates (ISIs). (A) Thin colored lines connect each individual participant’s performance in the single and multi-talker conditions. Group means across participants are indicated by the black circles connected by bold lines. (B) Dot density plots of individuals’ differences (multi–single-talker) in mean response time across ISIs. The solid line indicates the mean difference (multi–single-talker) across participants.
