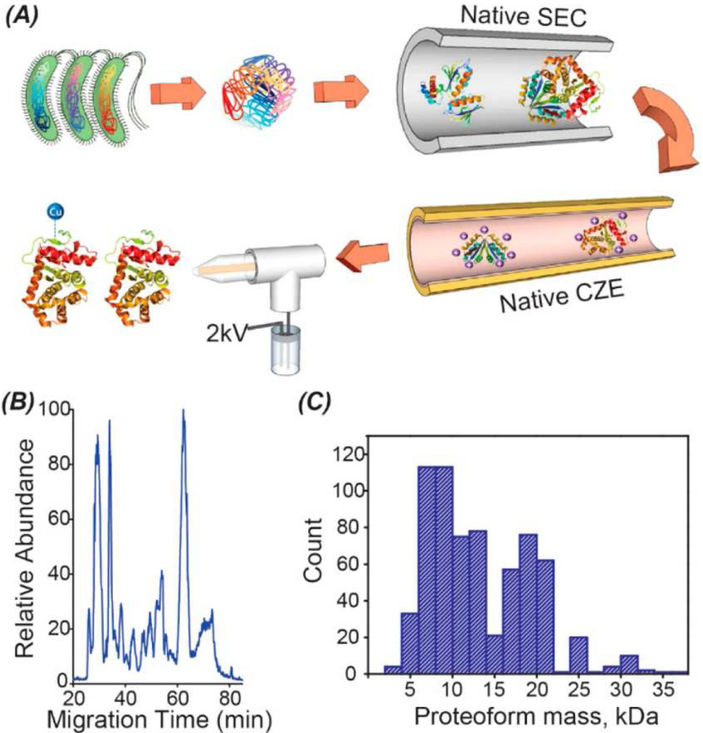
Fig. 6.
SEC-CZE-MS/MS for native top-down proteomics of E. coli cells [98]. The E. coli cells were lysed under a native condition and the extracted proteoforms were fractionated by native SEC, followed by native CZE-MS and MS/MS analysis for protein complex IDs (A). Native CZE-MS/MS analysis of one SEC fraction produced a 60-min separation window (B). The identified proteoforms had masses lower than 35 kDa (C). Reproduced with permission [98].

