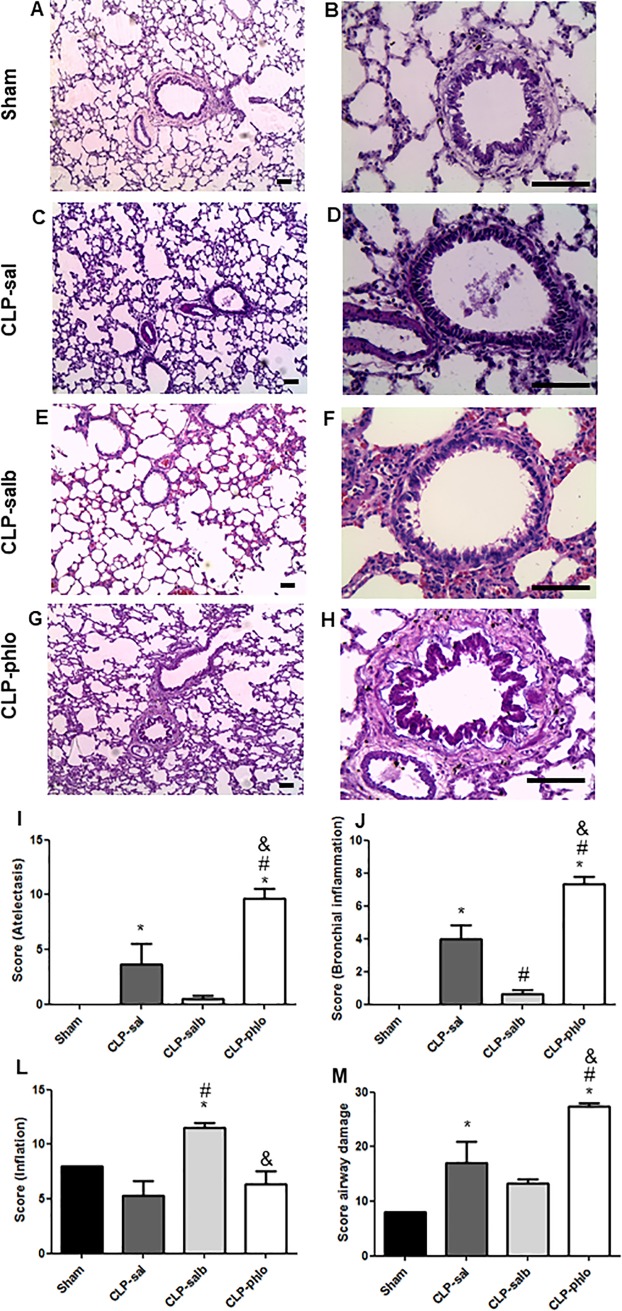
Fig 3. Analyses of lung tissue structure by hematoxylin-eosin staining.
Alveolar and bronchiolar structures in lung from Sham, CLP saline (CLP-sal), CLP salbutamol (CLP-salb) and CLP phlorizin (CLP-phlo) treated rats. Hematoxylin-eosin stained sections (A-H), Sham (A-B), CLP-sal (C-D), CLP-salb (E-F) and CLP-phlo (G-H) magnification, x400, and severity of atelectasis (I), bronchial inflammation (J), inflation (L) and airway damage scores (M); Images are representative of 4–5 animals in each group. Scale bar, 70 μm. *P <0.05 vs Sham; and #P <0.05 vs CLP-sal; &P < 0.05 vs CLP-salb. One-way ANOVA followed by Student-Newman-Keuls post-test.

