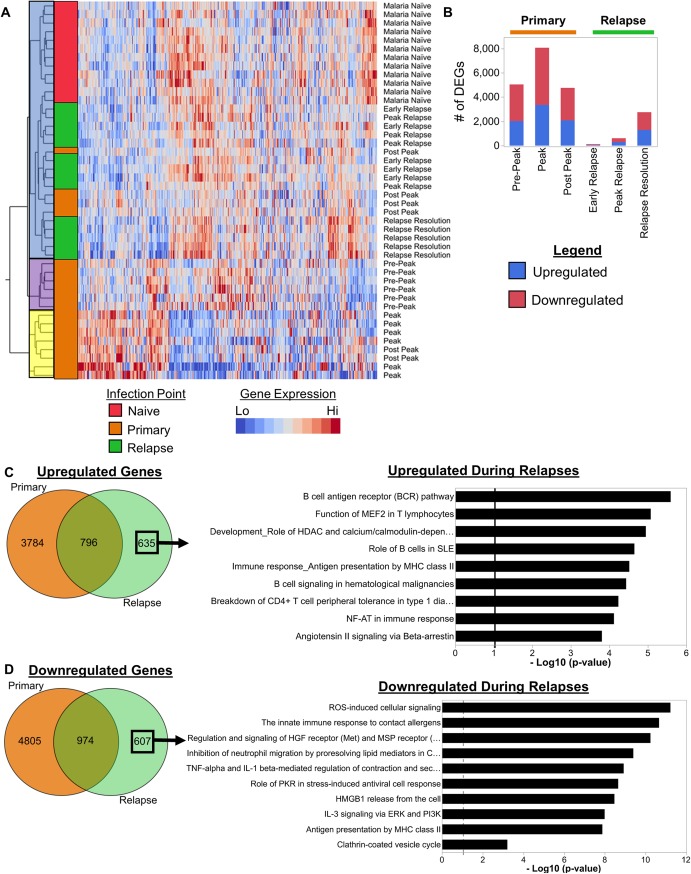
Fig 2. Plasmodium cynomolgi relapses cause distinct changes in host transcriptomes related to B cells.
(a) Hierarchical clustering using Ward’s method of whole blood transcriptomes at different infection points during P. cynomolgi M/B infections of rhesus macaques. (b) The number of differentially expressed genes identified at each infection point during primary and relapse infections. (c) Venn diagram showing the overlap of upregulated genes during primary infections and relapses. The upregulated gene pathways identified using the upregulated genes unique to relapses are shown. The solid black line in the pathway plots indicate an FDR corrected p-value of less than 0.05. (d) Venn diagram showing the overlap of downregulated genes during primary infections and relapses. The top 10 downregulated gene pathways identified using the downregulated genes unique to relapses are shown. The solid black line in the pathway plots indicates an FDR corrected p-value of less than 0.05.

