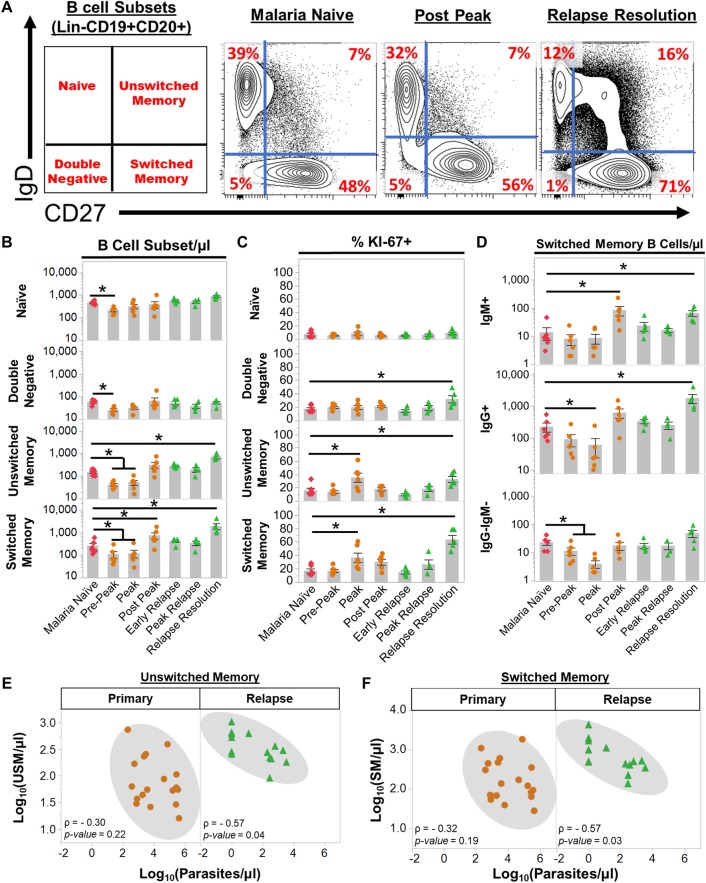
Fig 3. Plasmodium cynomolgi relapses induce an expansion of unswitched and switched memory B cells.
(a) The frequencies of four peripheral blood B cell subsets in rhesus macaques as determined by flow cytometry prior to infection (Malaria Naïve), after the peak of parasitemia during the initial infection (Post Peak), and during the resolution of a relapse (Relapse Resolution). A representative sample is shown. The far left panel indicates the B cell subset in each quadrant based on the gating strategy in S3 Fig. Red numbers in each quadrants indicate the percentage of each subset out of Lin-CD19+CD20+ B cells. (b) Absolute numbers of naïve, double negative, unswitched memory, and switched memory B cells at each infection point. (c) The percentage of each B cell subset that is KI67+ at each infection point as determined by flow cytometry. (d) The absolute number of IgG+, IgM+, and IgG-IgM- switched memory B cells during initial infections and relapses as determined by flow cytometry. (e) Spearman’s correlation analysis of the number of unswitched memory B cells and parasitemia during primary infections and relapses. (f) Spearman’s correlation analysis of the number of switched memory B cells and parasitemia during primary infections and relapses. Pink diamonds = malaria naïve, orange circles = initial infection, and green triangles = relapse infections. Gray bars indicate the mean of the data points shown; Error Bars = SEM. Statistical significance was assessed by a linear mixed effect model using a Tukey-Kramer HSD post-hoc analysis. Asterisks indicate a p-value < 0.05. ρ = Spearman’s correlation coefficient.

