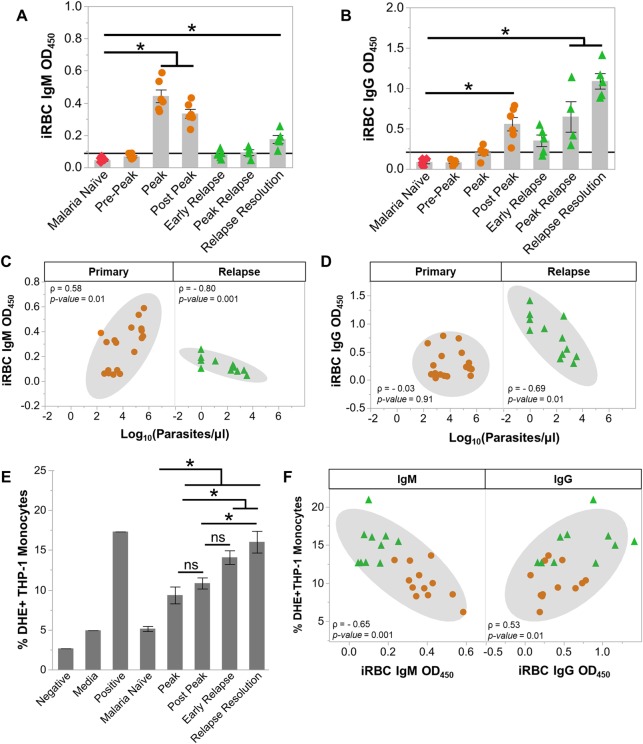
Fig 4. Anti-parasite IgG1 is produced rapidly during relapses and opsonizes P. cynomolgi infected RBCs.
Kinetics of anti-iRBC IgM (a) and anti-iRBC IgG (b) response during primary and relapses infections as determined by ELISA; the black line indicates background defined as the average of the malaria naïve time point plus three standard deviations. Spearman’s correlation analysis of anti-iRBC IgM (c) and anti-iRBC IgG (d) responses in relation to parasitemia during primary or relapse infections. (e) Percentage of THP-1 monocytes that phagocytosed P. cynomolgi M/B strain iRBCs after opsonization with heat-inactivated plasma collected at different infection points during initial infections and relapses. (f) Spearman's correlation analysis of opsonic phagocytosis activity and anti-iRBC IgM and IgG during primary infections and relapses. Gray bars indicate the mean of the data points shown; Error Bars = SEM. Statistical significance was assessed by a linear mixed effect model using a Tukey-Kramer HSD post-hoc analysis. Asterisks indicate a p-value < 0.05. ρ = Spearman’s correlation coefficient.

