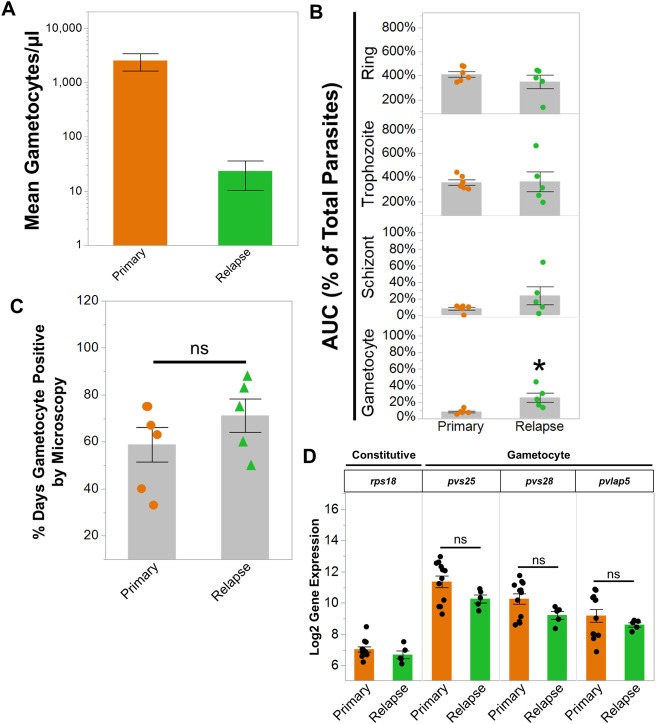
Fig 9. Clinically silent P. cynomolgi relapses harbor gametocytes.
(a) Absolute number of gametocytes during primary and relapse infections as determined by microscopy. (b) The area under the curve of the proportions of rings, trophozoites, schizonts, and gametocytes during primary and relapse infections. The cumulative percent area exceeds 100% for rings and trophozoites because the infections were more than a single day. (c) The percentage of days out of the primary and relapse infections when gametocytes were observed by microscopy. (d) Gene expression of representative constitutive and gametocyte genes as determined by RNA-Seq during primary and relapse infections. All gametocyte genes are P. cynomolgi homologues of P. vivax genes implicated in transmission; the P. vivax gene annotation is listed for simplicity. Bars in all graphs indicate the mean log2 gene expression of the data points shown or average percent of each stage; Error Bars = SEM. Statistical significance was assessed by a paired t-test. Asterisks indicate a p-value < 0.05; ns = not significant.

