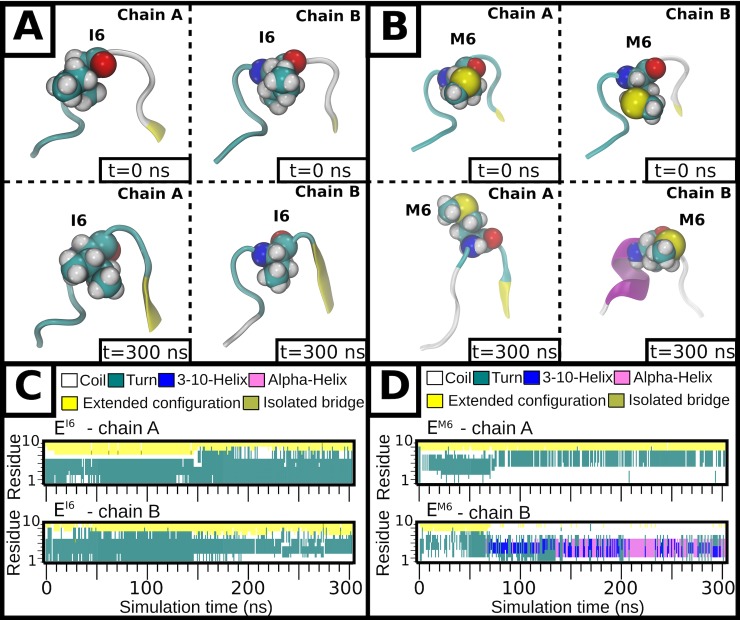
Fig 5. MD simulations showing the stability of the N-terminal loop of the E protein protomers within a dimer in the EI6 and EM6 systems.
The initial (t = 0 ns, top) and final (t = 300 ns, bottom) conformations of the N-terminal loop (residues 1–10) are shown for both protomers (chains A and B) of the (A) EI6 and (B) EM6 systems. The protein backbone is shown as ribbons and colored according to the secondary structure. Residue number 6 is shown as sphere (carbon in cyan, nitrogen in blue, oxygen in red and hydrogen in grey). The per-residue secondary structure propensity for the N-terminal loop over simulation time is shown for each chain in the (C) EI6 and (D) EM6 systems.

