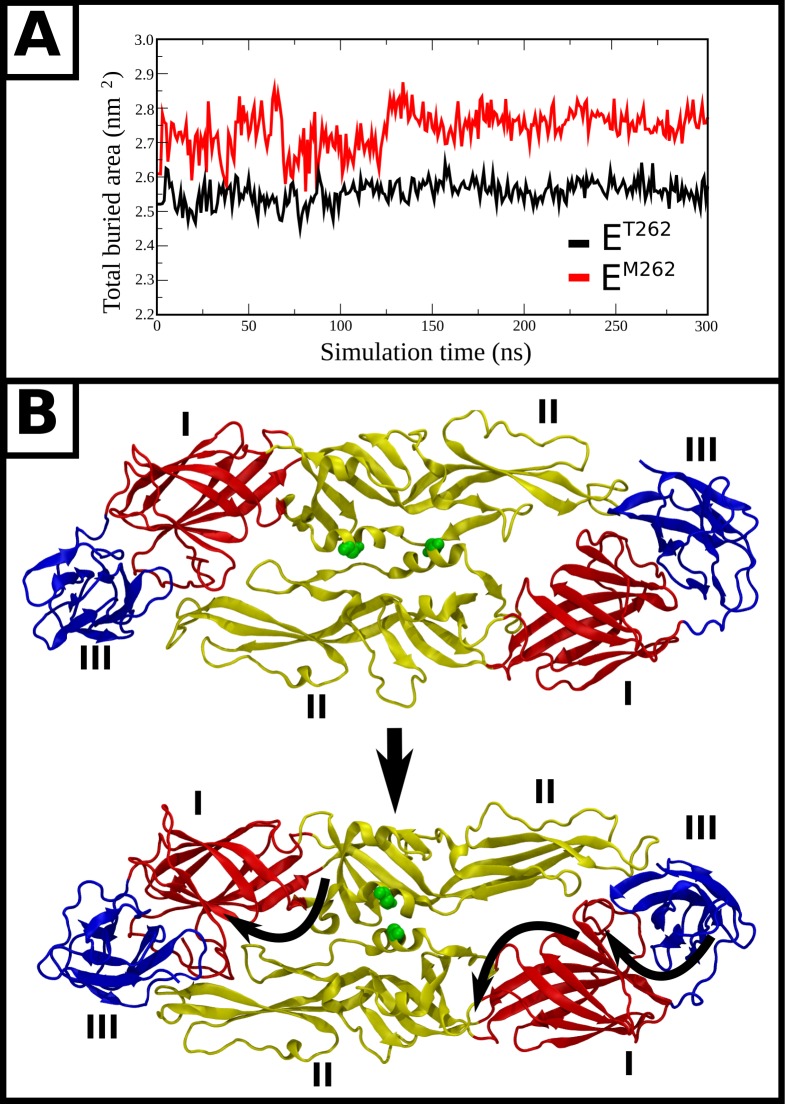
Fig 8. MD simulations showing conformational changes in the E protein dimer induced by mutation of ET262 to EM262.
(A) The total buried surface area between helical residues 250–265 from opposing chains is shown with respect to simulation time for both systems. (B) The two extreme conformations generated by principal component analysis (PCA) from a filtered trajectory representing the dominant motion of the E protein dimer in EM262 The protein is shown as ribbons, with red, yellow and blue corresponding to domains I, II, and III respectively. M262 backbone atoms are shown as green spheres. Curly arrows represent the directions of motion of domains I, II, and III.

