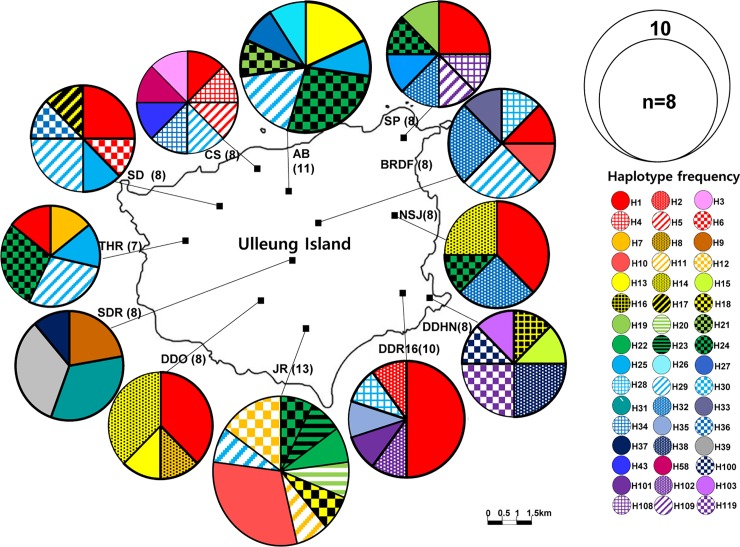
Fig 3. Map of haplotypes found in R. takesimensis.
Distribution of each haplotype and its frequency found in R. takesimensis from Ulleung Island. The size of each circle is proportional to the population size. Different colored and patterned portions in each pie chart represent haplotype frequencies.

