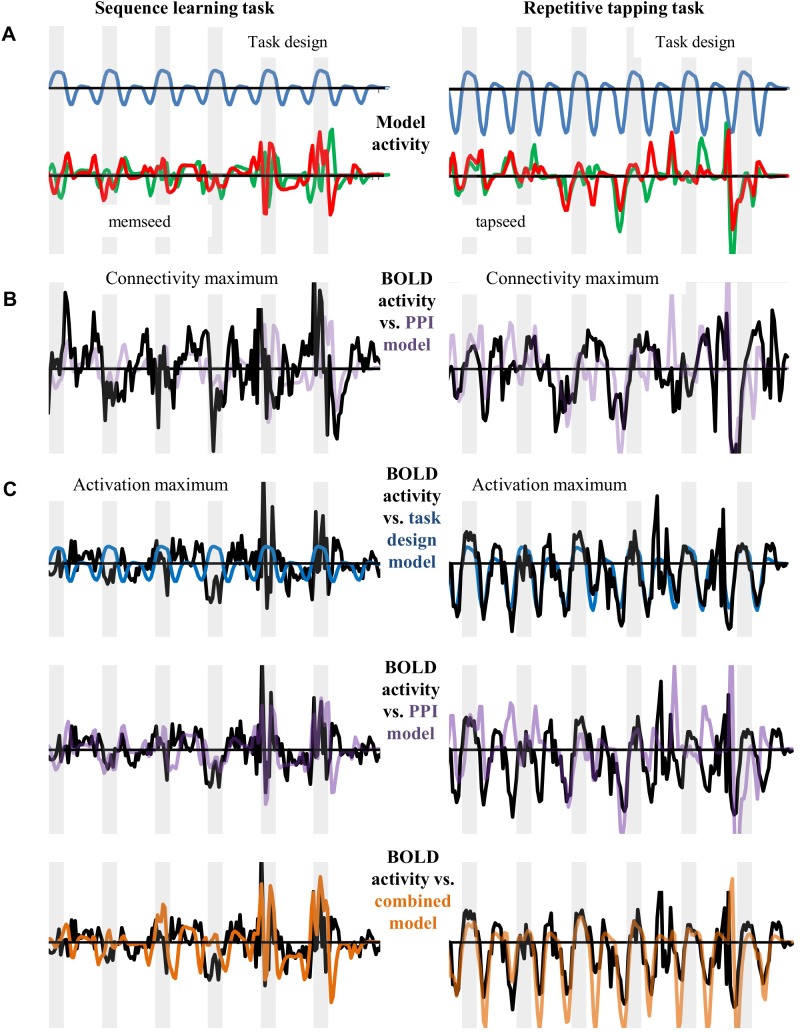
Fig 2. Independence of activation and connectivity analysis.
(A) Predicted patterns of BOLD activation (top, blue), and connectivity from the left and right hippocampal seeds (bottom, green and red, respectively). (B) BOLD activity observed at the SMC connectivity maximum (black) compared with activity predicted from the sum of the activity from the left and right hippocampal seeds (purple). (C) BOLD activity observed at the SMC activation maximum (black) compared to the predicted pattern for activation (top, blue), the sum of activity from left and right hippocampal seeds (middle, purple), and the sum of activation plus hippocampal activity (bottom, orange).

