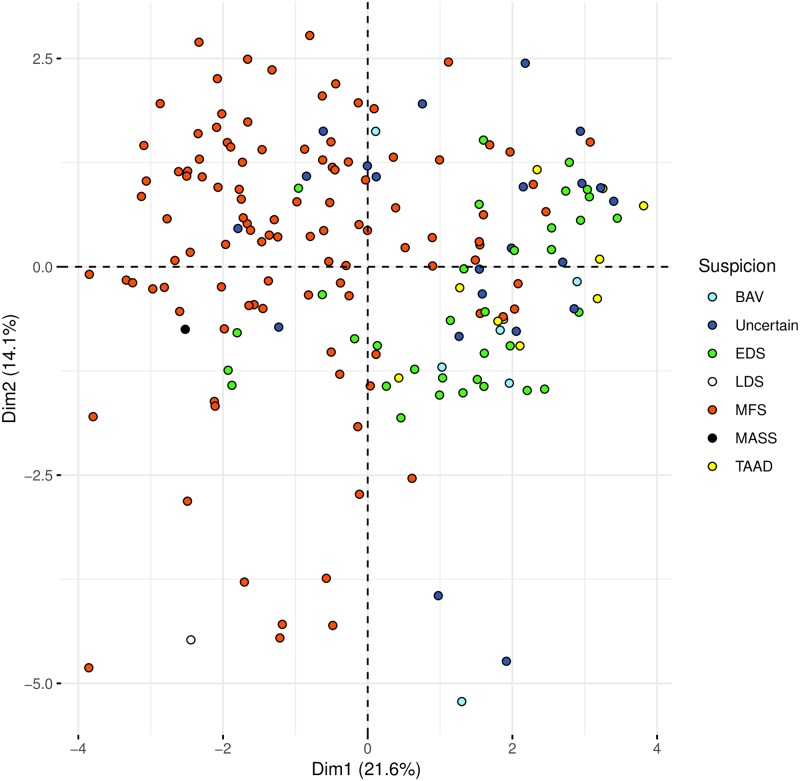
Fig 1. Dimensionality reduction of the phenotypic data and clinical suspicion.
The complexity of variability of all the phenotypic traits was reduced using the statistical approach Factor Analysis for Mixed Data (FAMD). Starting from a great number of phenotypic variables, a reduced set of new variables called dimensions were calculated. These new variables are still able to describe the complexity of original phenotypic traits. In particular, the new variables obtained are ordered considering the percentage of variance that they are able to collect. The first two dimensions explain respectively the 21.63% and the 14.06% of the total phenotypic variability. Plots were obtained using the first two dimensions. The first dimension (Dim 1) mainly collects information regarding clinical suspicion of MFS, indeed the majority of the patients showing a clinical suspicion of MFS are closer and have negative values of Dim 1 and are localized on the left part of the panel while samples with a clinical diagnosis of EDS and TAAD, with positive values of Dim 1, are mainly located in the right part of the panel.

