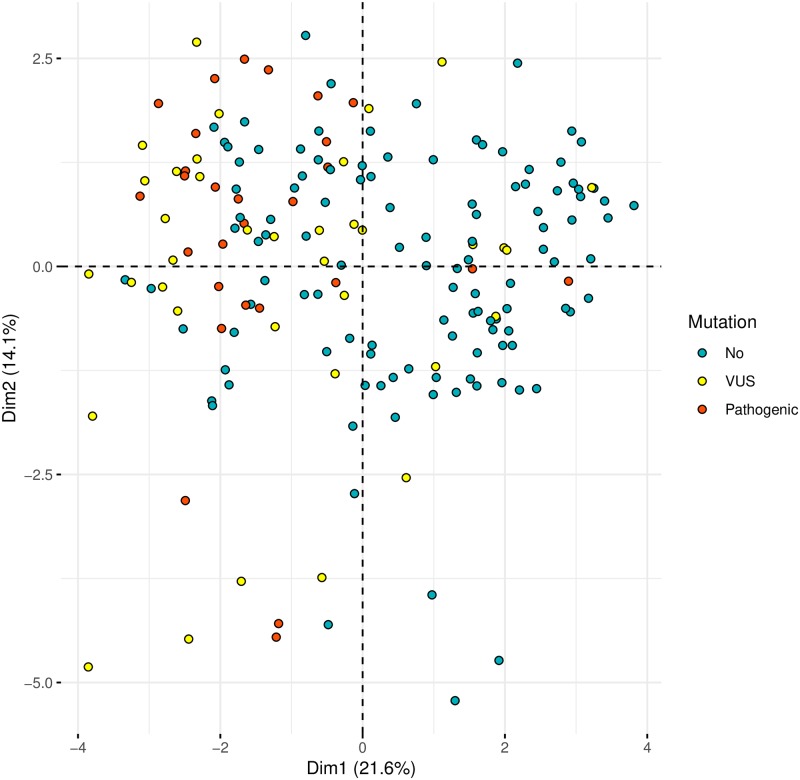
Fig 2. Dimensionality reduction of the phenotypic data and mutation.
Dimension reduction obtained by Factor Analysis for Mixed Data (FAMD) is used to visually identified patients with a pathogenic in FBN1, TGFBR1, TGFBR2. Plots were obtained using the first two dimensions. There is a significant association between Dim 1 and the probability to find a mutation in MFS main genes. Indeed subjects carrying a pathogenic variant in FBN1 or TGFBR1/2 genes are positioned in the left part of the panel.

