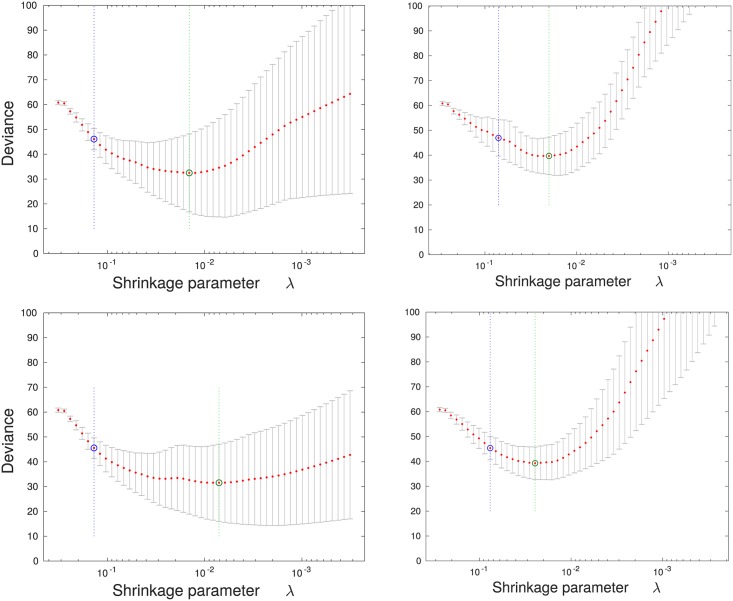
Fig 6. Training curves for classification of Alzheimer’s disease vs. a healthy diagnosis (left column) and Alzheimer’s disease vs. MCI (right column).
The graphs on the top row arise from when the path signature method is used to derive features, and the graphs on the bottom row from the log signature method. In each case the graph shows the optimisation of the Lasso shrinkage parameter λ using 10-fold cross validation, where the value of λ increases from right to left. Deviance is a measure of the estimate of the expected negative likelihood of the parameter applied to new data. The green circle and vertical line locate the minimum cross validation error, and the blue circle and vertical line to the left locate the value of λ with minimum cross-validation error plus one standard deviation.

