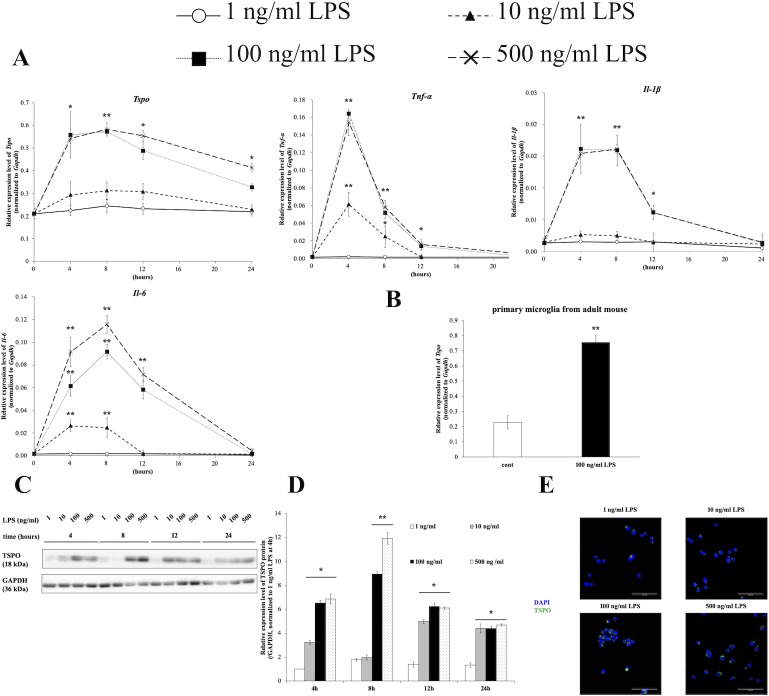
Fig 1. LPS induced Tspo expression in the microglial cell line BV-2.
(A) BV-2 cells were treated for the indicated time and with the indicated dose of LPS, and RNA was then extracted and subjected to qRT-PCR for Tspo, Tnf-α, IL-1β, IL-6 and Gapdh. The expression level of each mRNA was measured and normalized to that of Gapdh mRNA. The asterisks indicate statistically significant differences compared to 1 ng/ml LPS (n = 3, *p<0.05, **p<0.01). (B) Primary microglial cells from adult mice were stimulated with 100 ng/ml LPS for 8 hours and were then subjected to qRT-PCR. (C) BV-2 cells were treated as described above. The protein expression level of TSPO was measured using Western blot analysis. (D) Densitometric analysis of TSPO expression using ImageJ. The expression value was measured and normalized to that of GAPDH as the internal control. The asterisks indicate statistically significant differences (n = 3, *p<0.05, **p<0.01). (E) Microscopy images showing TSPO expression. BV-2 cells were stimulated with 1, 10, 100 or 500 ng/ml LPS for 8 hours and immunocytochemistry was then carried out. Images of nuclear (DAPI, blue) and TSPO (green) staining were acquired at 40× magnification. Scale bar: 100 μm.

