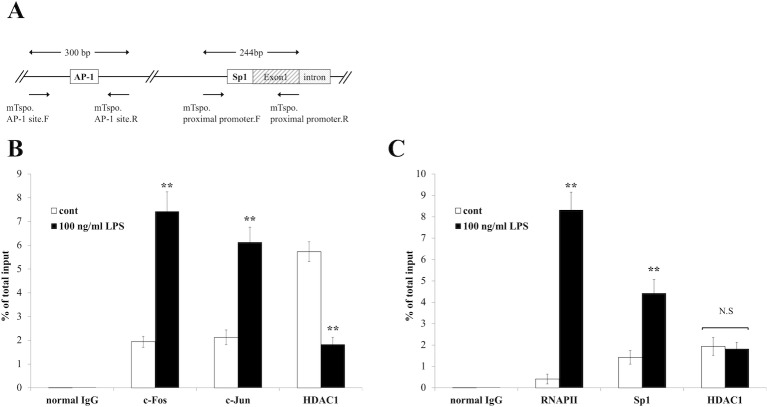
Fig 4. Enrichment of AP-1 and Sp1 was increased and enrichment of HDAC1 was decreased in the Tspo gene regulatory region by LPS treatment.
(A) Schematic of the upstream region of the mouse Tspo gene and the positions of the primers used for the ChIP assay. (B) Enrichment of c-Fos, c-Jun and HDAC1 at the AP-1 binding site. BV-2 cells were treated with 100 ng/ml LPS for 2 hours. Then, ChIP analyses were performed as described in the Materials and methods section. (C) Enrichment of RNAP II, Sp1 and HDAC1 in the proximal promoter region. The Y-axis indicates the quantity of PCR products normalized to that of the input for each sample. The asterisks indicate statistically significant differences from the control (n = 3, p<0.01).

