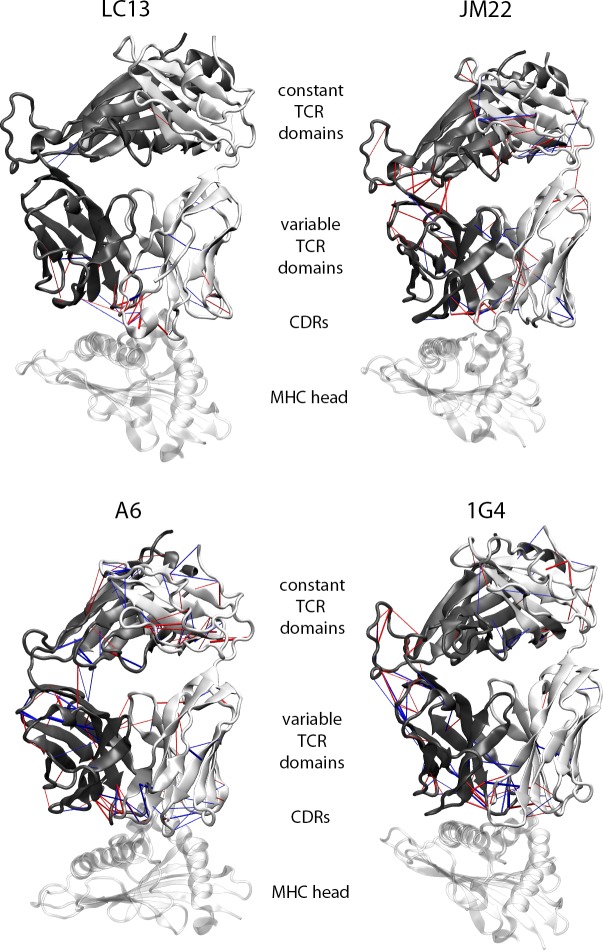
Fig 7. 3D visualisation of H-bond patterns within the four TCRs based on PyHVis3D [14].
The radius of the cylinders is proportional to the difference between TCRpMHC simulations and TCR simulations where red cylinders indicate more H-bonds in TCRpMHC simulations while blue cylinders indicate more H-bonds in TCR simulations. Only H-bonds with a difference > 6% are shown as a boot strapping analysis (S1 Fig) indicates that theseH-bonds would not be seen by chance. TCR α-chain (white), TCR β-chain (dark grey), and peptide/MHC head (transparent white) are shown aligned by TCR orientation.

