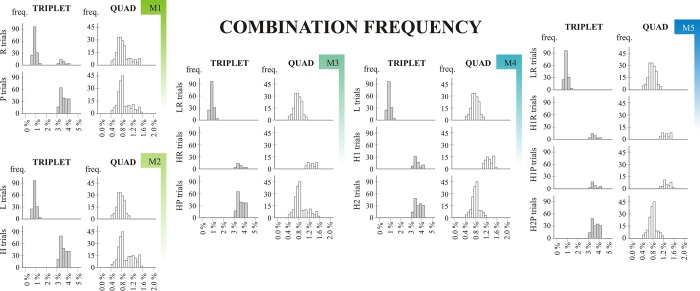
Fig 3. Combination frequency.
M1 –Model 1; M2 –Model 2; M3 –Model 3; M4 –Model 4; M5 –Model 5. Combination frequency histograms are based on the ninth epoch (final ~400 trials) of a randomly chosen subject (subject number 111). The X axis shows the combination frequencies that occured in the given epoch of the ASRT task; the Y axis represent the frequency with which these occured. Two (triplet level) or three (quad level) preceding trials were taken into consideration when calculating joint probabilities (represented in different columns). Different rows represent different statistical categories within Models.

