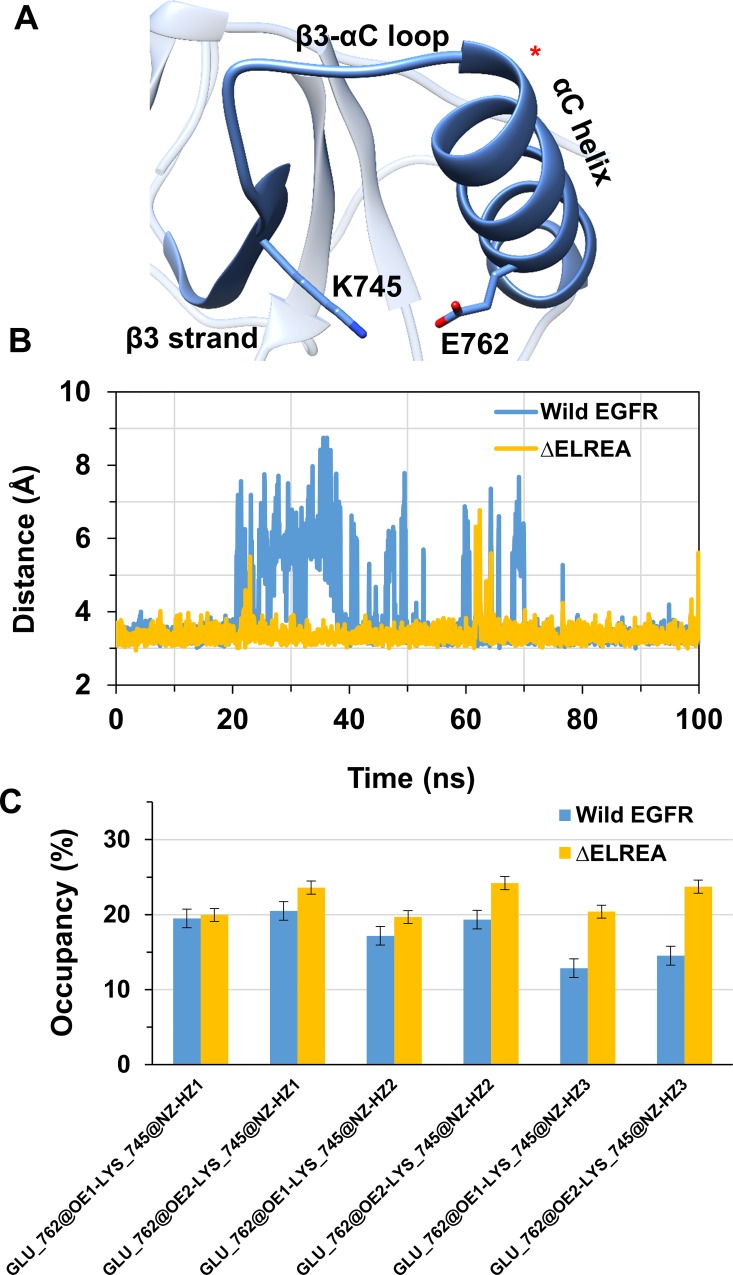
Fig 7. EGFR E762…K745 salt bridge behaviour during the MDS.
(A) Key salt bridge formed between K745 and E762 in the active EGFR kinase (shown in sticks). (B) Distance between K745 and E762 during the 100 ns simulation. Wild-type active EGFR (blue) displays longer distances and more fluctuations in the distances between Cδ of Glu762 and Nζ of Lys745 of the ion pair as compared to ΔELREA EGFR (gold). The Cδ⋯Nζ distances of the salt bridge are provided in S1A Fig. C) Percentage occupancy of hydrogen bonds between terminal hydrogen atoms HZ1-3 of K745 and carbonyl oxygen atoms Oε1 and Oε2 of E762 in the wild-type and ΔELREA EGFRs.

