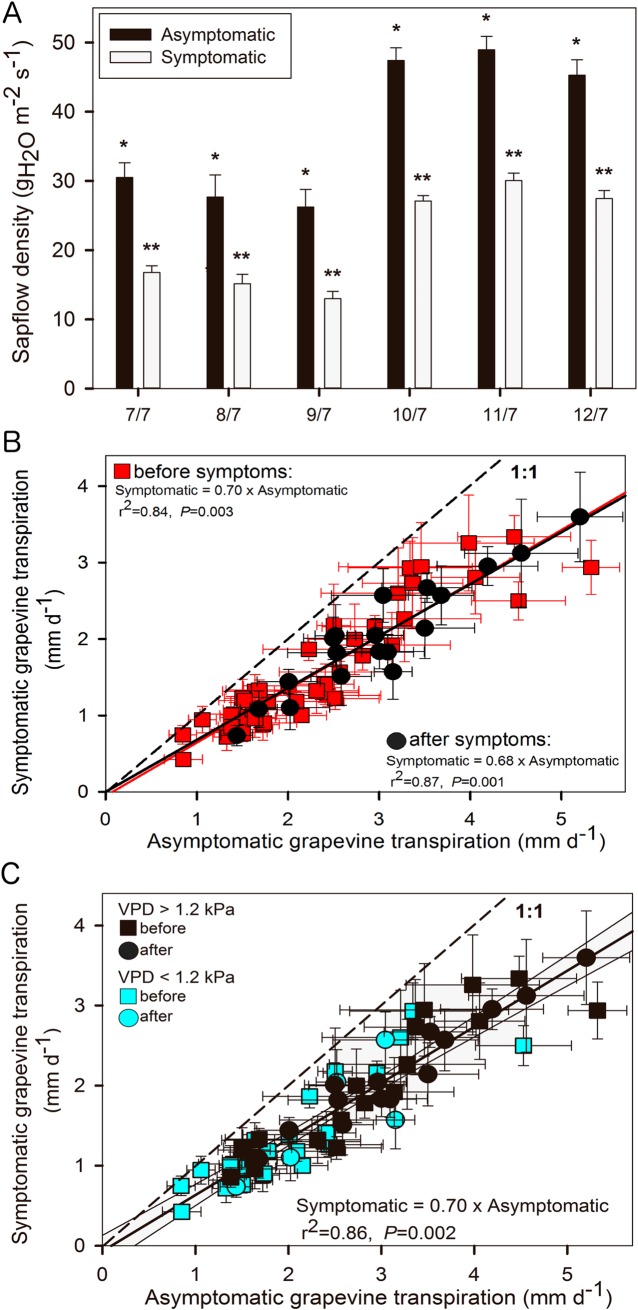
Fig 3. Comparison of daily sap flow densities and whole plant transpiration in asymptomatic and symptomatic Cabernet Sauvignon grapevines.
(A) Mean maximum daily sap flow densities in asymptomatic and symptomatic grapevines during the week preceding the onset of Esca-foliar symptoms. Data represent transpiration values under non-limited light conditions, i.e. recorded between 10:00 a.m. and 4:00 p.m. Error bars represent SE and a different number of stars for a given date indicates a significant difference between asymptomatic and symptomatic grapevines at p<0.05. (B) Mean daily transpiration in asymptomatic and symptomatic grapevines. Data were separated to reflect days “before” (red squares) and “after” (black circles) the apparition of the foliar Esca symptoms. Error bars represent SE. (C) Mean daily transpiration in asymptomatic and symptomatic grapevines. Data were separated to reflect days with high (black symbols) and low (blue symbols) maximum vapour pressure deficit (VPD), and to represent days “before” (squares) and “after” (circles) the apparition of the foliar Esca symptoms. Error bars represent SE.

