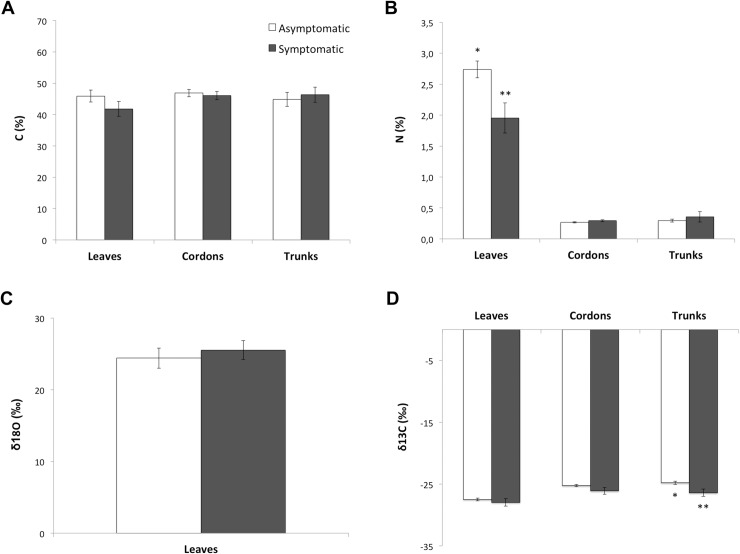
Fig 6. Elemental and isotopic analysis of leaf, cordon and trunk samples collected from symptomatic and asymptomatic grapevines.
(A) Percentage of carbon and (B) percentage of nitrogen in leaves, cordons and trunks of symptomatic and asymptomatic grapevines. (C) Oxygen isotope discrimination (δ18O) in leaves and (D) carbon (δ13C) isotope discrimination in leaves, cordons and trunk of symptomatic and asymptomatic grapevines. For each type of measurement, non-necrotic samples were used. White Error bars represent SE and a different number of stars for a given tissue indicates a significant difference between asymptomatic (white columns) and symptomatic (black columns) grapevines at p<0.05.

