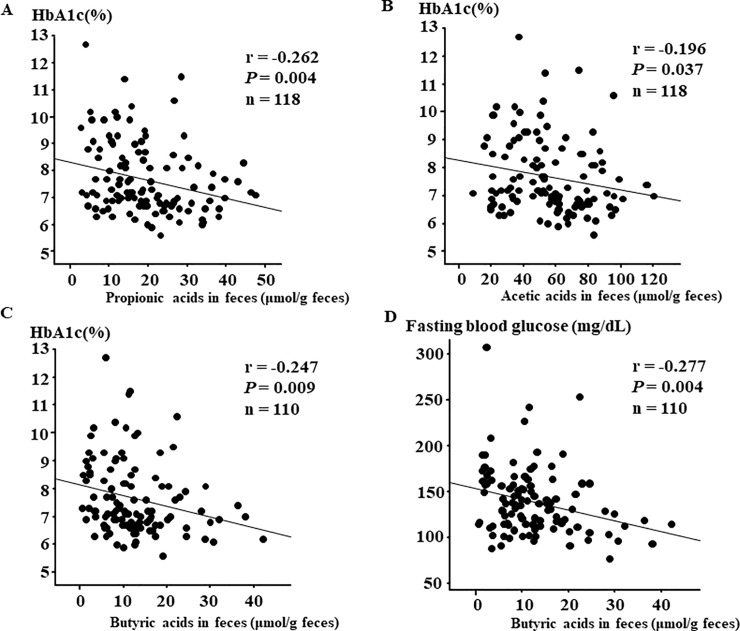
Fig 3. Correlations between glycemic control and organic acids in feces.
Correlation between (A) HbA1c and propionic acids in feces (r = -0.262, P = 0.004, n = 118), (B) HbA1c and acetic acids in feces (r = -0.196, P = 0.037, n = 118), (C) HbA1c and butyric acids in feces (r = -0.247, P = 0.009, n = 110) and (D) fasting blood glucose and butyric acids in feces (r = -0.277, P = 0.004, n = 110).

