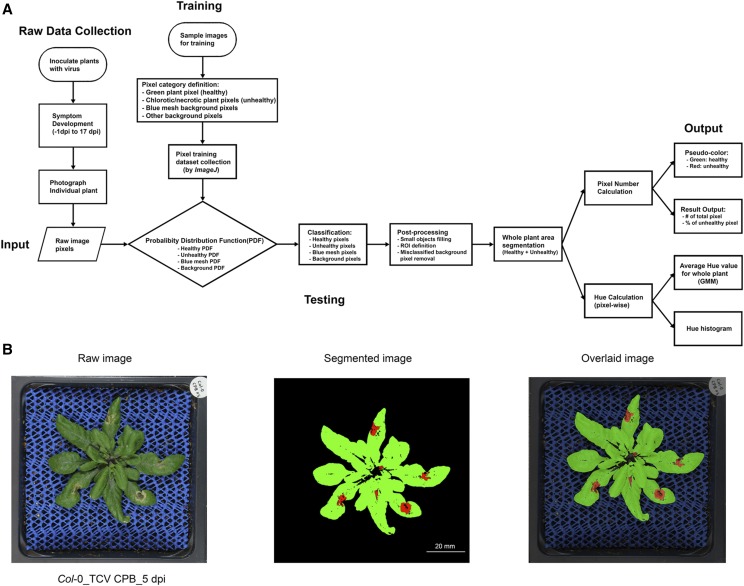
Figure 2.
Image-based traits analysis workflow outline. A, Workflow chart. Plants were inoculated with virus or mock solution. In the raw data collection section, individual plant was photographed from 1 d preinoculation to 17 dpi. In the training session, representative sample images were chosen. Four pixel-classifiers were defined and RGB information of 1,891 pixels in each class were collected to build up the training dataset. The Probability Distribution Function for each category was calculated based on the training dataset. In the testing session, each pixel from an input image was calculated and classified into each class. After postprocessing, the pipeline produced a summary of pixel number in each class and the hue value for each pixel in each raw image. Then appropriate statistics was applied to quantify and compare the output results among different groups. B, One example of original raw plant image, segmented pseudo-color image, and overlaid image of Col-0 plant inoculated with TCV CPB at 5 dpi.

