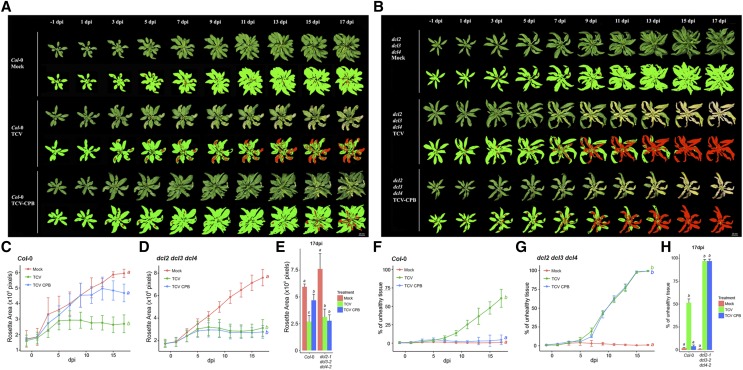
Figure 3.
TCV-infection–caused temporal changes in rosette size and the percentage of unhealthy tissues in control plants. A and B, Temporal visualization of rosette leaves and the corresponding pseudo-color images of Col-0 (A) and dcl2 dcl3 dcl4 (B) plants inoculated by TCV, TCV CPB inoculum, or mock solution. Photos were taken individually from 1 d preinoculation to 17 dpi, and digitally extracted and aligned for comparison. In the pseudo-color images, green color referred to healthy plant pixels; red color referred to chlorotic/necrotic (unhealthy) plant pixels. C and D, The growth curves show the temporal change of rosette area (total pixel number, averaged by four plants, ±se) in Col-0 (C) and dcl2 dcl3 dcl4 (D) plants from 1 d preinoculation to 17 dpi (K-S test with α = 0.05). E, The box plot shows the rosette size at 17 dpi. Statistical analysis was calculated between treatments in each genotype. Boxes with different letters are statistically different (n = 4, Tukey post hoc test with α = 0.05). F and G, The curves show the percentage of unhealthy tissue change over time (red pixels/total pixels, averaged by four plants, ±se) in Col-0 (F) and dcl2 dcl3 dcl4 (G) plants from 1 d preinoculation to 17 dpi (K-S test with α = 0.05). H, The box plot shows the percentage of unhealthy pixels at 17 dpi. Statistical analysis was calculated between treatments in each genotype. Boxes with different letters are statistically different (n = 4, Tukey post hoc test with α = 0.05).

