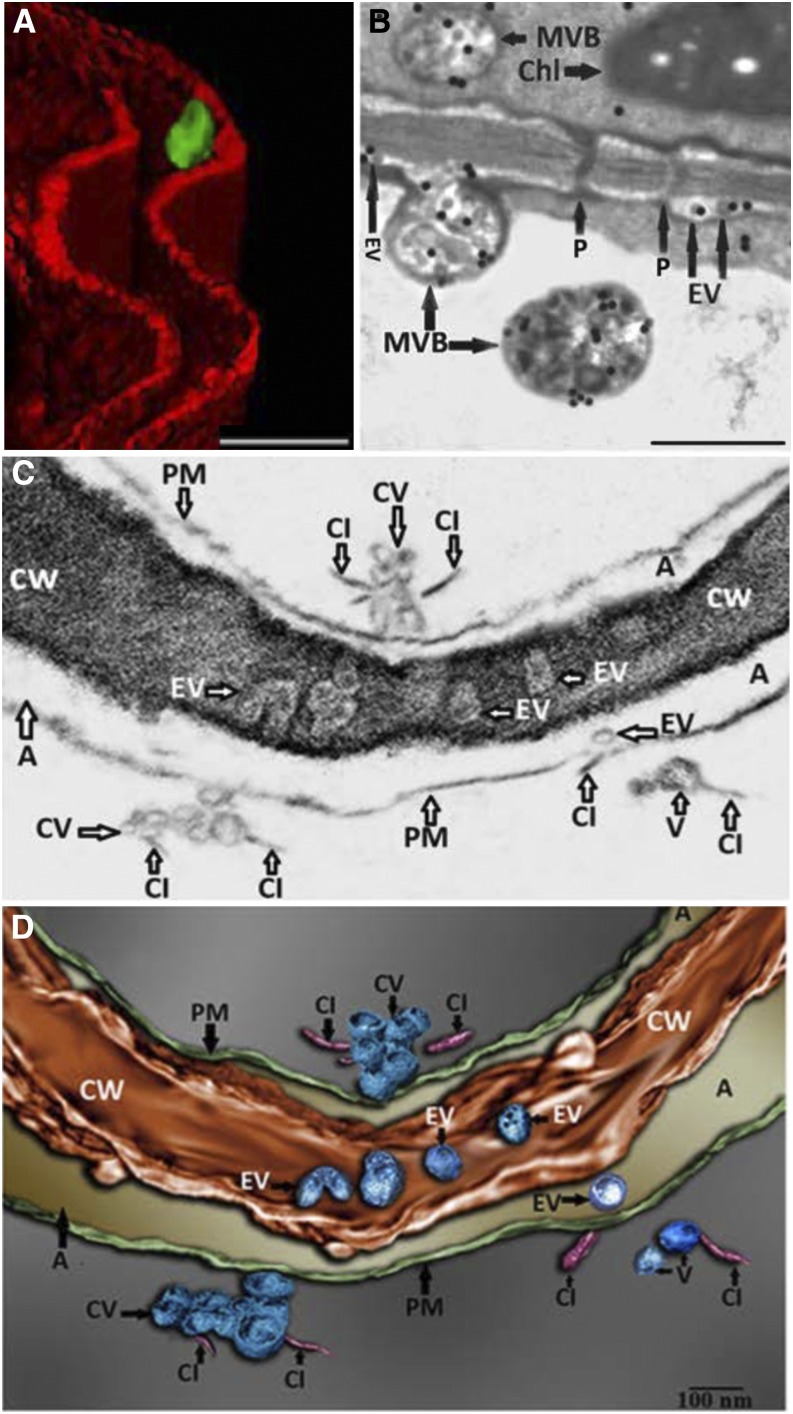
Figure 1.
Imaging of TuMV EVs in infected N. benthamiana leaves. A, 3D reconstruction from confocal micrographs of leaves infected with TuMV encoding GFP-tagged 6K2. The plasma membrane was stained with the endocytic dye FM4-64 (red). Scale bar = 2 μM. B, Infected leaves were immunolabeled with nanogold particles that detect double-stranded RNA, a marker for replicating virus. Scale bar = 500 nm. C, A single image obtained using FIB–EHRSEM, focusing on the extracellular space between two juxtaposed TuMV-infected cells. Scale bar = 100 nm. D, 3D rendered image using FIB–EHRSEM, showing vesicles in the extracellular space and cell wall. Scale bar = 100 nm. A, apoplast; Chl, chloroplast; CI, cylindrical inclusion body; CV, cluster of vesicles; CW, cell wall; P, plasmodesmata; PM, plasma membrane. Images adapted from figures 1, 3, and 4 in Movahed et al. (2019).

