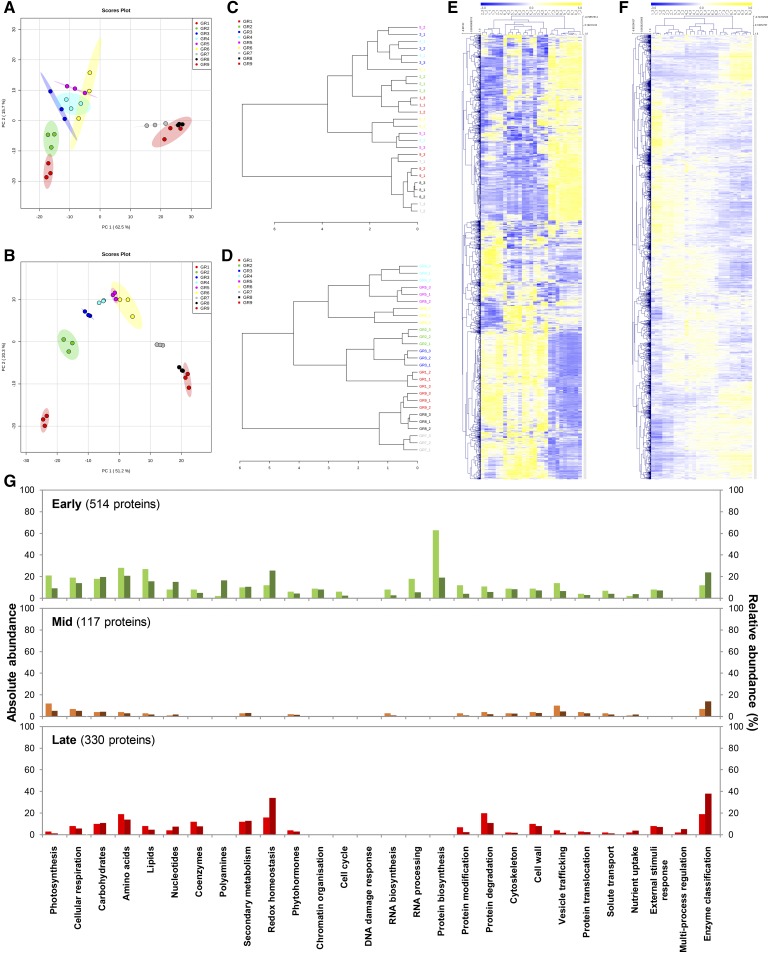
Figure 3.
Multi- and univariate statistical analyses reveal differential induction patterns for transcript and protein abundances during fruit development. Abundance data of transcripts and proteins that paired together (2,375) were normalized before statistical analyses (median normalization, cube-root transformation, Pareto scaling). A and B, Global overview of unfiltered transcriptomic (A) and proteomic (B) profiles by PCA (n = 3; max variance explained is shown in brackets) indicates stage-specific responses during fruit growth. C and D, Dendrograms showing relationship between transcript (C) and protein (D) samples (Pearson’s correlation) confirmed multivariate outputs from PCA. E and F, Bidimensional clustering analysis of transcript (E) and protein (F) profiles (Pearson’s correlation) revealing distinct abundance patterns. G, Protein profiles were filtered by ANOVA (P < 0.01 with adjusted Bonferroni) yielding 1,363 proteins, then subsequently clustered by Pearson’s correlation (see Supplemental Fig. S2), which revealed three main clusters: “Early” (514 proteins), “Mid” (117), and “Late” (330). Proteins that paired with transcripts, or belonging to the different clusters, were mapped to metabolic function using Mercator4 (v1.0). For each metabolic function, absolute (left bars, light colors) and relative (right bars, dark colors) abundances are shown on the left and right axes, respectively.

