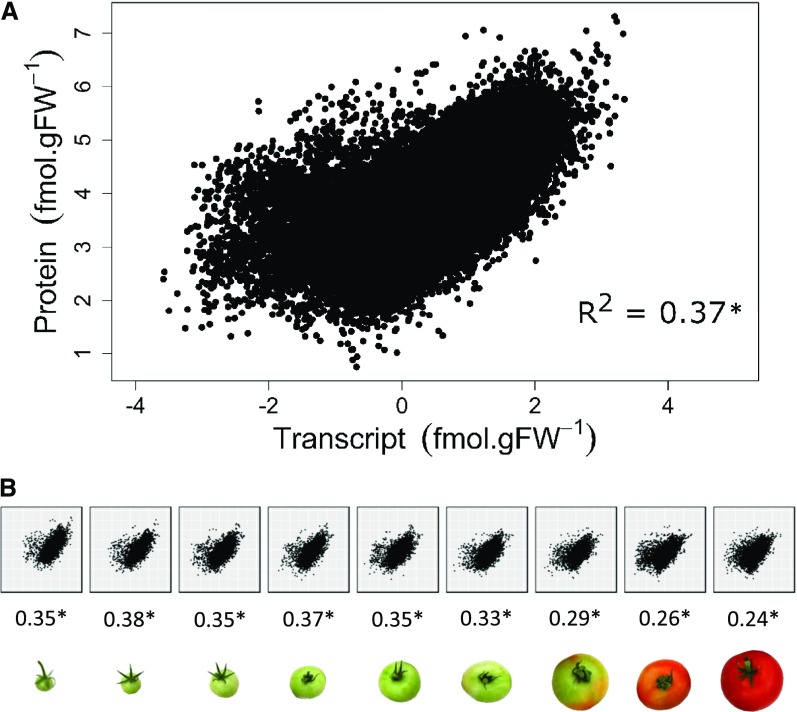
Figure 4.
Correlation between 2,375 protein and transcript abundancies during fruit development. A, Correlation plot obtained for all stages. B, Correlation plots obtained at each of the nine stages identified by stage of fruit development. Correlation coefficients (R2) are given below each plot. Data were log-transformed before analysis.

