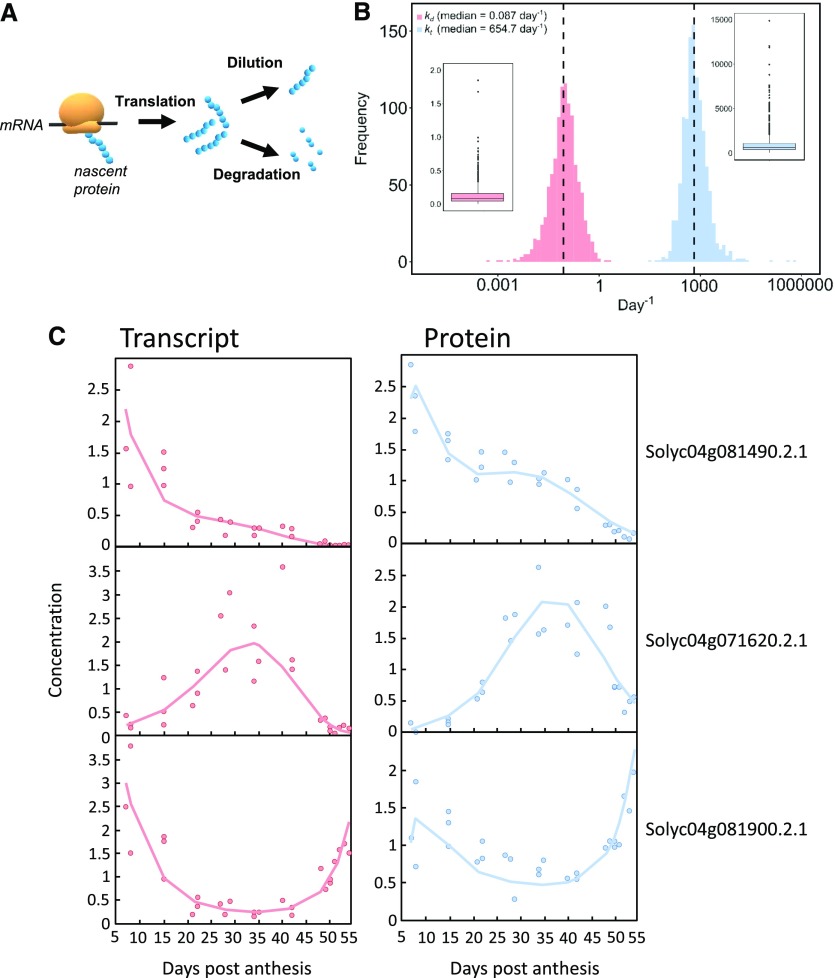
Figure 5.
Mathematical model of protein translation and degradation. A, Scheme of the main processes described in the mathematical model. B, Distribution and boxplot of both rate constants for translation (kt) and degradation (kd) that were satisfactorily fitted with the model for 1,103 proteins. C, Three satisfactorily fitted profiles of transcripts and proteins, for which protein peaks occurred at early, mid, and late stages of fruit development. Symbols correspond to transcript (red) and protein (blue) normalized experimental data. The red lines represent the fitting of the mRNA data and the blue line the fitting of the protein data.

