Figure 6.
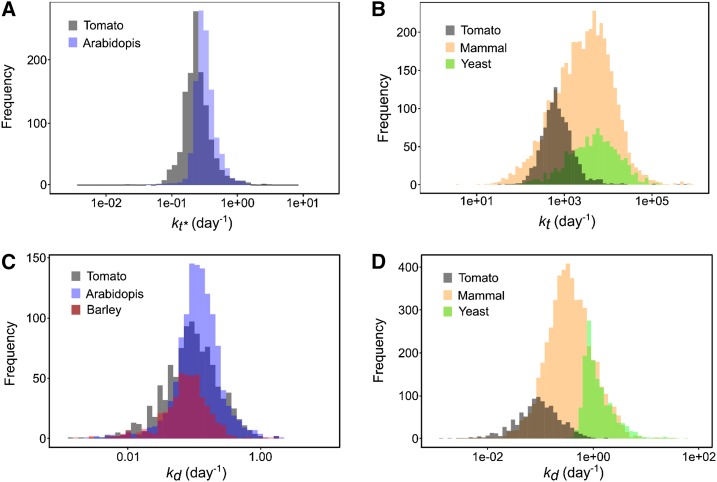
Comparison of rate constants between organisms. A, Distribution of 1,103 translation rate constants kt* calculated for proteins of tomato fruit (gray, median 0.31 d−1) superimposed with 1,228 values from Arabidopsis leaf (blue, median 0.23 d−1; Li et al., 2017). B, Distribution of 1,103 translation rate constants kt calculated for proteins of tomato fruit (gray, median 772 d−1) superimposed with 1,115 values of yeast (green, median 4,930 d−1; Lahtvee et al., 2017) and 4,247 values of mammal cells (yellow, median 2,981 d−1; Schwanhäusser et al., 2011). C and D, Distribution of 1,103 degradation rate constants kd calculated for proteins of tomato fruit (gray median 0.113 d−1) superimposed with (C) 1,228 values from Arabidopsis leaf (blue, median 0.113 d−1; Li et al., 2017) and 505 values from barley leaf (purple, median 0.076 d−1; Nelson et al., 2014) and with (D) 1,384 values of yeast (green, median 1.03 d−1; Lahtvee et al., 2017) and 5,028 values of mammal cells (fibroblast cells yellow, median 0.347 d−1; Schwanhäusser et al., 2011). All rate constant values were log10-scaled.

