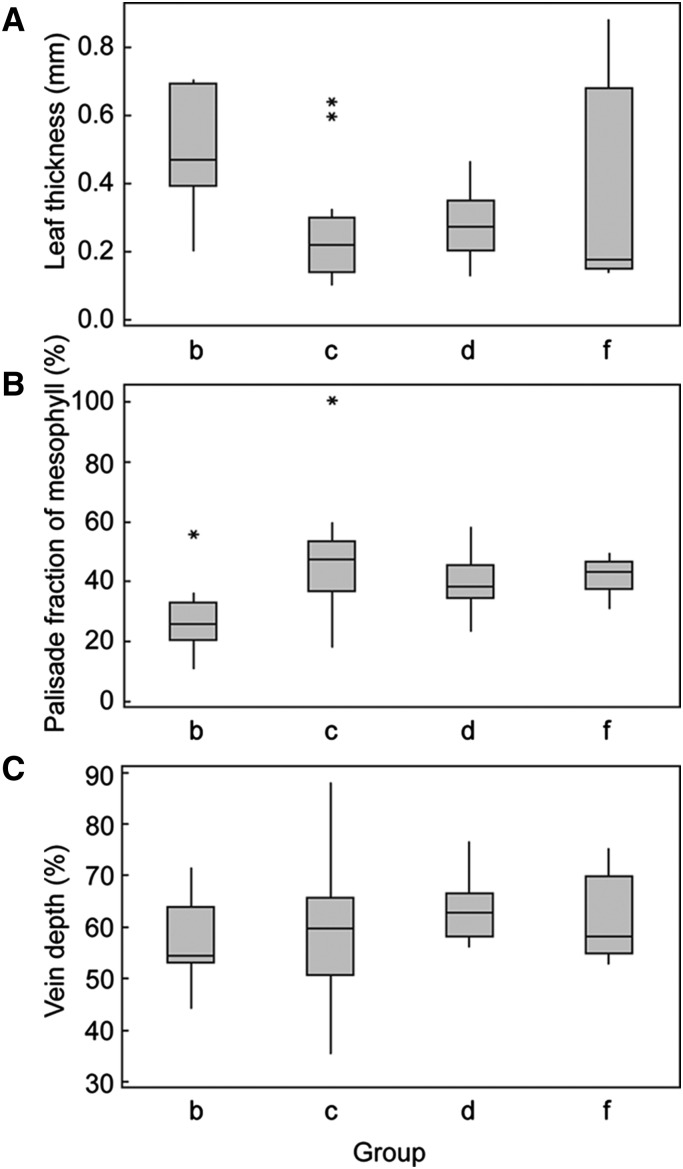
Figure 4.
Differences in traits among groups with distinct chlorophyll profiles. Box plots of leaf thickness (A), palisade fraction of mesophyll (B), and relative vein depth (C) by group derived from hierarchical cluster analysis. Excludes groups a and e with single species. Boxes represent interquartile range and lines across boxes represent group median. Whiskers extend from the upper and lower quartiles to the group maximum and minimum, respectively. Asterisks represent sample outliers.

