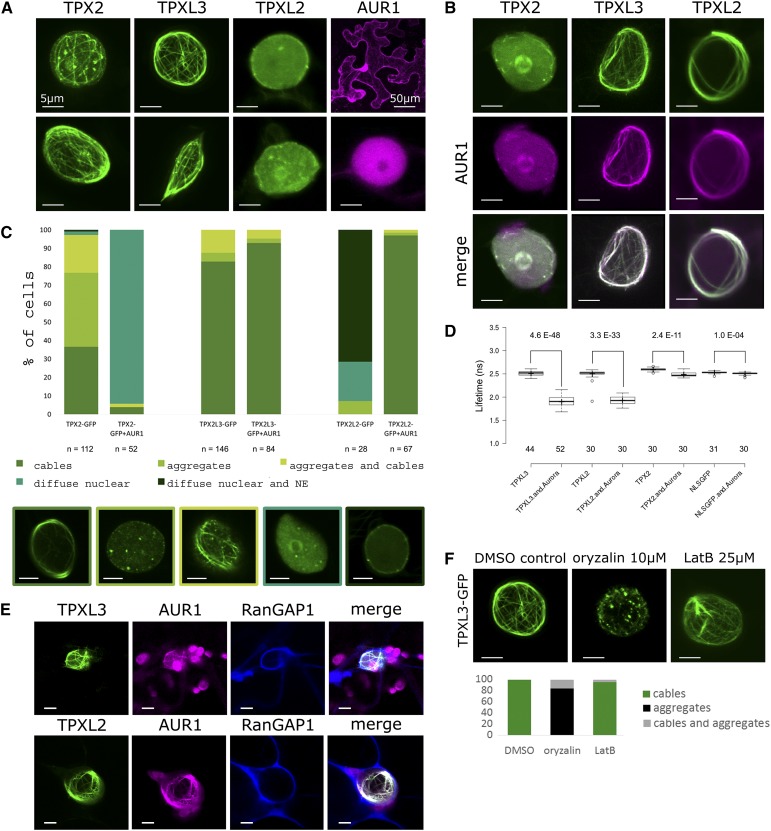
Figure 2.
TPX proteins interact with AUR1 in planta and initiate intranuclear MT nucleation/polymerization. A–C, Representative localizations (A and B) and quantification of the observed localization patterns (C, n = number of nuclei) for TPX2, TPXL3, and TPXL2 with and without AUR1 in N. benthamiana leaf epidermal cells. Single expression of TPX2 and TPXL3, but not TPXL2, causes the formation of intranuclear aggregates and cables resembling cytoskeletal filaments. AUR1 is diffuse nuclear and cytoplasmic (A and C). Coexpression of TPX2, TPXL2, and TPXL3 with AUR1 differently affects TPX/L localization. AUR1 has a negative impact on the bundling activity of TPX2, is recruited to the bundles formed by TPXL3 and activates the bundling activity of TPXL2 (B and C). Images below (C) represent the different classes of localizations observed. Left to right: cables (TPX2-GFP); aggregates (TPX2-GFP); aggregates and cables (TPX2-GFP); diffuse nuclear (TPX2-GFP and AUR1); diffuse nuclear and NE (TPX2L2-GFP). D, FLIM analysis of cotransformed N. benthamiana epidermal cells. Coexpression of TPX-GFP with AUR1-mRFP reduces the donor lifetime. The reduction in lifetime values is the most pronounced for TPXL2 and TPXL3 (from 2.5 to 1.9 ns); the lifetime decrease of TPX2 is less dramatic (from 2.59 to 2.48). The lifetime of NLS-GFP hardly changes when combined with AUR1 (from 2.53 to 2.51). Numbers represent Student’s t test P values (top) and the number of nuclei analyzed (bottom). E, Triple localization of TPXL3 or TPXL2 (green), AUR1 (magenta), and the NE marker RanGAP1 (blue) in N. benthamiana epidermal cells shows that the cable-like structures form inside the nuclei outlined by RanGAP1. F, The intranuclear cables marked by the TPX proteins are MTs. TPXL3-GFP localization to the cable-like intranuclear structures is sensitive to a 1-h treatment of 10-μm oryzalin (n = 25) and changes from intranuclear cables into a predominantly aggregated pattern in nuclei when compared to the DMSO control (n = 20). LatB does not affect the localization of TPXL3-GFP (1 H, 25 μM, n = 21). All scale bars = 5 μm, except for the top-right corner image in (A), which is = 50 μm.

