Figure 3.
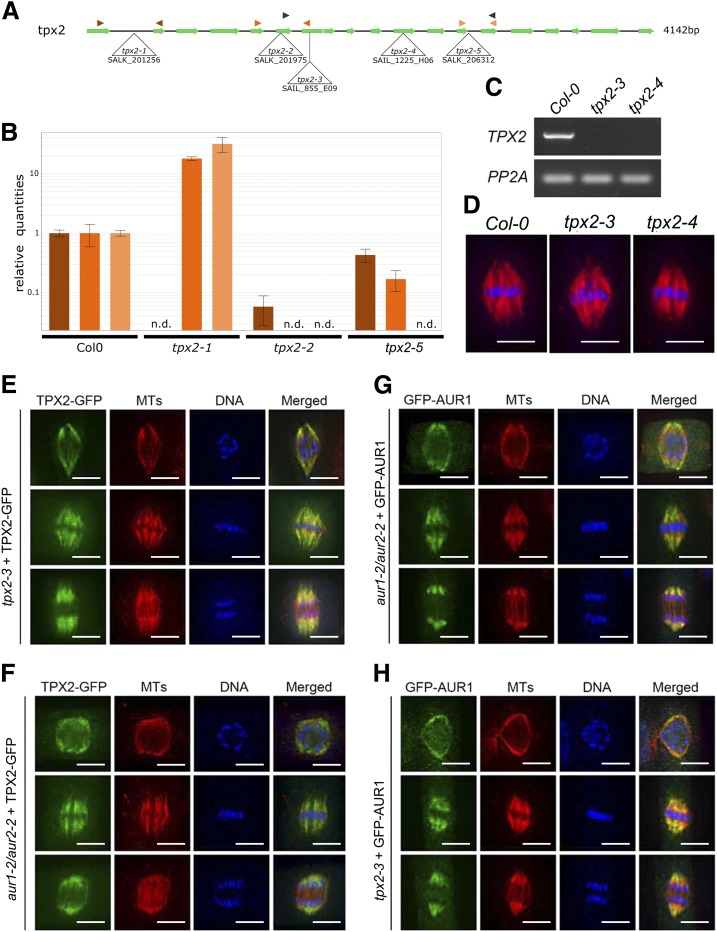
Mutant analysis reveals TPX2 as nonessential. A, Schematic overview of the gene model for TPX2 with indication of the positions of the T-DNA insertion alleles analyzed. Primer pairs used for RT-qPCR and RT-PCR analysis are indicated by color-coded arrowhead pairs. B, RT-qPCR analysis of homozygous tpx2-1, tpx2-2, and tpx2-5 mutants using the three different primer pairs shown in (A). Error bars represent se. The graph shows the absence of full-length transcripts over the T-DNA positions (n.d., not detected). C, Using the primers marked by the black arrowheads in (A), RT-PCR of homozygous tpx2-3 and tpx2-4 mutants show the absence of transcript compared to wild type (Col-0). The constitutively expressed PP2A gene was set as the positive control. D, Similar spindle MT arrays are formed in metaphase cells in the control (Col-0) and homozygous tpx2-3 and tpx2-4 plants. The immunofluorescent images have MTs pseudo-colored in red and DNA in blue. E and F, TPX2-GFP localization upon expression in the null tpx2-3 mutant (E) and in homozygous aur1-2/aur2-2 double mutant cells (F). Representative cells are at late prophase (top row), metaphase (middle row), and anaphase (bottom row). TPX2-GFP is pseudo-colored in green, MTs in red, and DNA in blue. TPX2-GFP localizes to the prospindle MTs in prophase and K-fiber MTs at metaphase and anaphase. No obvious difference was detected between the control and aur1-2/aur2-2 mutant cells. G and H, GFP-AUR1 localization in complemented aur1-2/aur2-2 (G) and in tpx2-3 mutant cells (H). Representative cells are at late prophase (top row), metaphase (middle row), and anaphase (bottom row). GFP-AUR1 is pseudo-colored in green, MTs in red, and DNA in blue. GFP-AUR1 localizes to the prospindle MTs in prophase and K-fiber MTs at metaphase and anaphase. No obvious difference was detected between the control and tpx2 mutant cells. Images shown are representative examples chosen out of >10 individual images for each cell cycle phase. Scale bars = 5 μm.

