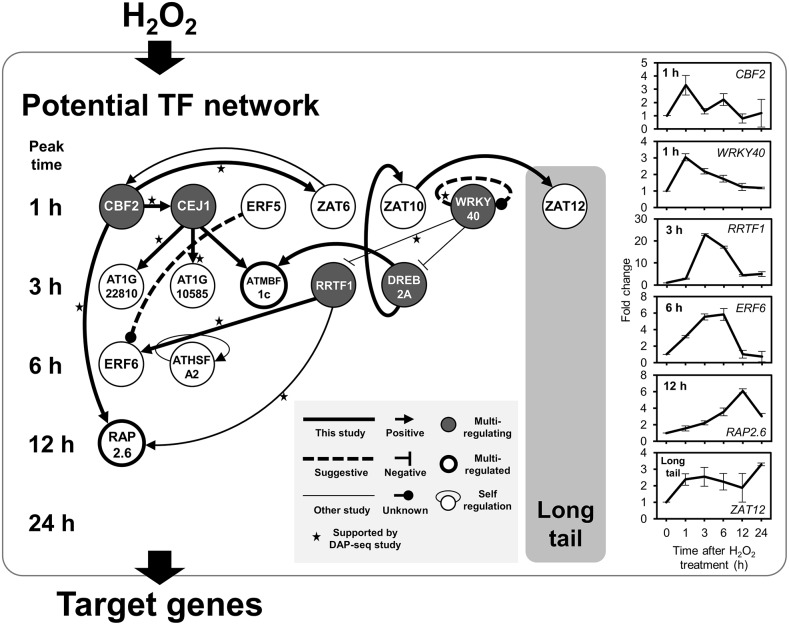
Figure 7.
Transcriptional regulatory network activated by H2O2. A directional line means that an upstream TF protein directly regulates gene expression of its downstream TF. Positive and negative regulation was judged based on gene expression data of each TF knockout and/or overexpressor (Supplemental Table S8). A dotted line shows potential autoregulation which is only supported by the data from in vitro binding analysis. Five examples of direct regulation of a TF protein to a target promoter have been reported in previous studies: ZAT6 to CBF2 (Shi et al., 2014); WRKY40 to DREB2A (Shang et al., 2010) and to RRTF1 (Pandey et al., 2010); RRTF1 to RAP2.6 (Matsuo et al., 2015), which was confirmed in this study; and ATHSFA2 autoregulation (Liu et al., 2013). Stars indicate the regulations are supported by in vitro bindings detected in the cistrome study using DAP-seq (O’Malley et al., 2016). Line graph shows expression pattern of representative TF gene in the network. Average fold change and se were obtained from triplicate microarray data.

