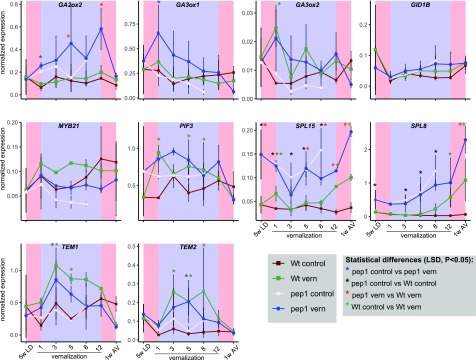
Figure 6.
Effects of PEP1 and vernalization on the expression of GA-related genes. RT-qPCR expression analysis is shown for genes involved in the GA pathway during vernalization in pep1-1 versus wild-type (Wt) plants. Plants were grown for 5 weeks in LD, then transferred to 4°C for 12 weeks or kept under control conditions (SD; 21°C), and then shifted back to LD. Apical samples were taken at Zeitgeber time 8 (ZT8). Data are shown as means ± se (n = 2 biological replicates). Expression was normalized to PP2A. Significance was tested using ANOVA. On the x axis, 5LD indicates plants grown for 5 weeks in LD before vernalization, numbers represent weeks in vernalization, and 1AV represents plants grown for 1 week after vernalization.

