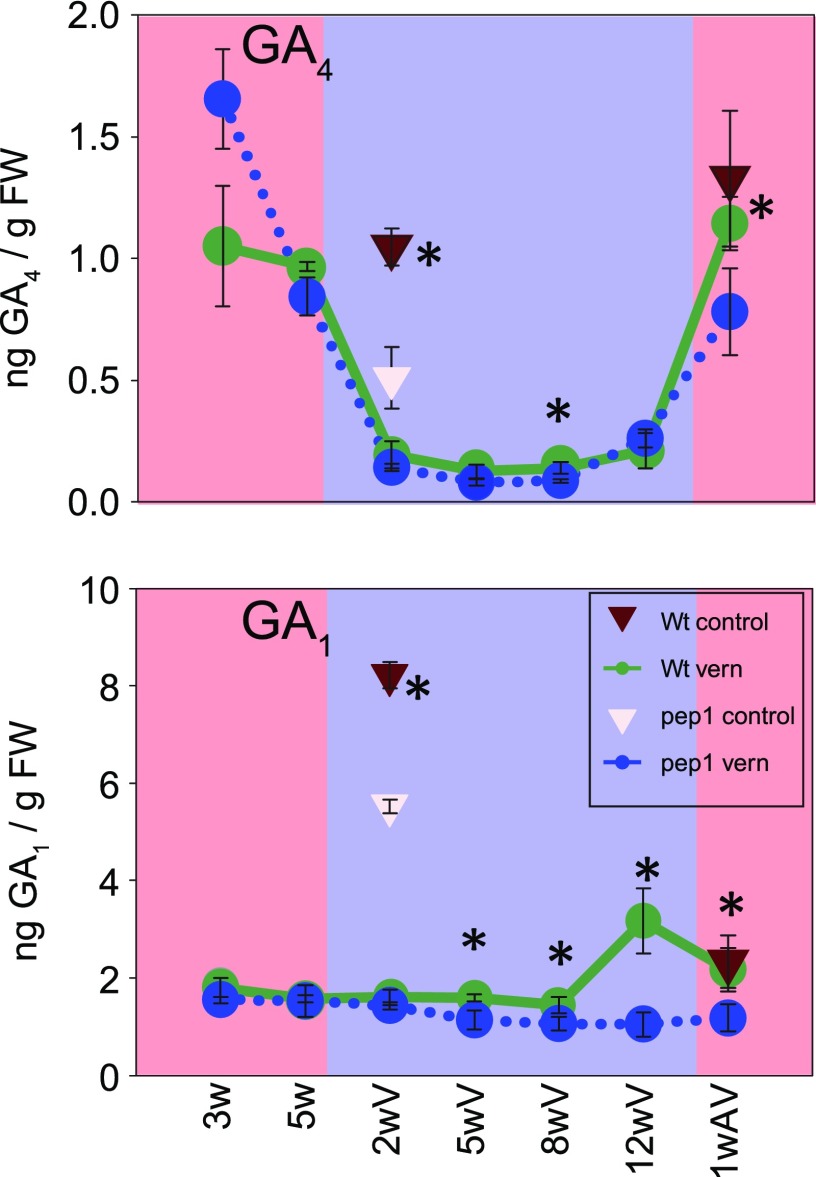
Figure 7.
Effects of PEP1 and vernalization on levels of active GA. Levels of active GAs in apices of pep1-1 and wild-type (Wt) plants are shown. Plants were grown for 5 weeks in LD, then transferred to 4°C for 12 weeks or kept under control conditions (SD; 21°C), and then shifted back to LD. Apical samples were taken at ZT8. Data are shown as means ± sd (n = 3 biological replicates, except the wild type and pep1-1 at 5 weeks of LD, where n = 2). Asterisks indicate significant differences between genotypes at the same time points (*, P ≤ 0.05, Student’s t test). FW, Fresh weight.

