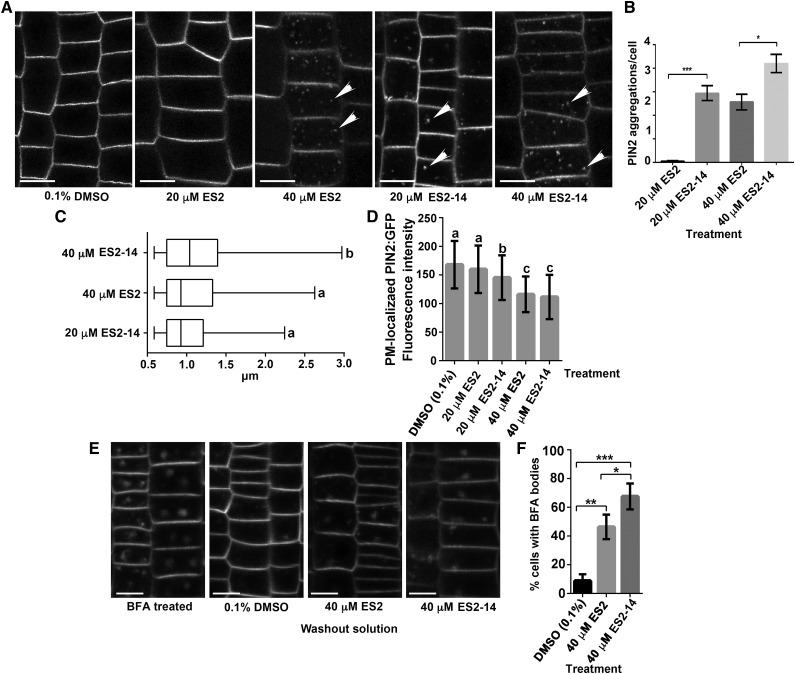
Figure 2.
Inhibition of PIN2 trafficking by treatment with ES2 and ES2-14. A, PIN2:GFP localization after treatment with DMSO or different concentrations of ES2 and ES2-14 for 2 h. Scale bars = 10 μm. B, Numbers of PVCs containing PIN2:GFP in Arabidopsis root epidermal cells treated with ES2 or ES2-14 for 2 h. ES2-14 is more effective in promoting PIN2 localization to the PVC. Data represent the means ± sd (n = 90 cells from eight seedlings). C, Boxplot showing the size distribution (Feret diameter) of PVCs containing PIN2:GFP, as shown in B. D, Quantification of the fluorescence intensity of PM-localized PIN2 on root epidermal cells treated with DMSO, ES2, or ES2-14. Data represent means ± sd (n = 120 cells from eight seedlings). E, Representative images of PIN2 localization after treatment with 40 μm of BFA for 1 h followed by 80 min recovery in one-half strength MS liquid media with 0.1% DMSO, 40 μm ES2, or 40 μm ES2-14. F, Numbers of BFA-induced compartments with PIN2:GFP in root epidermal cells after 80 min recovery in one-half strength liquid MS. ES2-14 is more effective than ES2 in reducing PIN2:GFP exocytic trafficking. Data represent the means ± sd (n = 110 cells from four seedlings). Asterisks indicate significant difference as determined by paired t test: *P < 0.05; **P < 0.01; ***P < 0.0001. Lowercase letters in C indicate significant differences between groups (P < 0.05) as determined by paired t test, and those in D indicate significant differences between groups (P < 0.05) as determined by one-way ANOVA test followed by Tukey’s multiple comparisons test.

