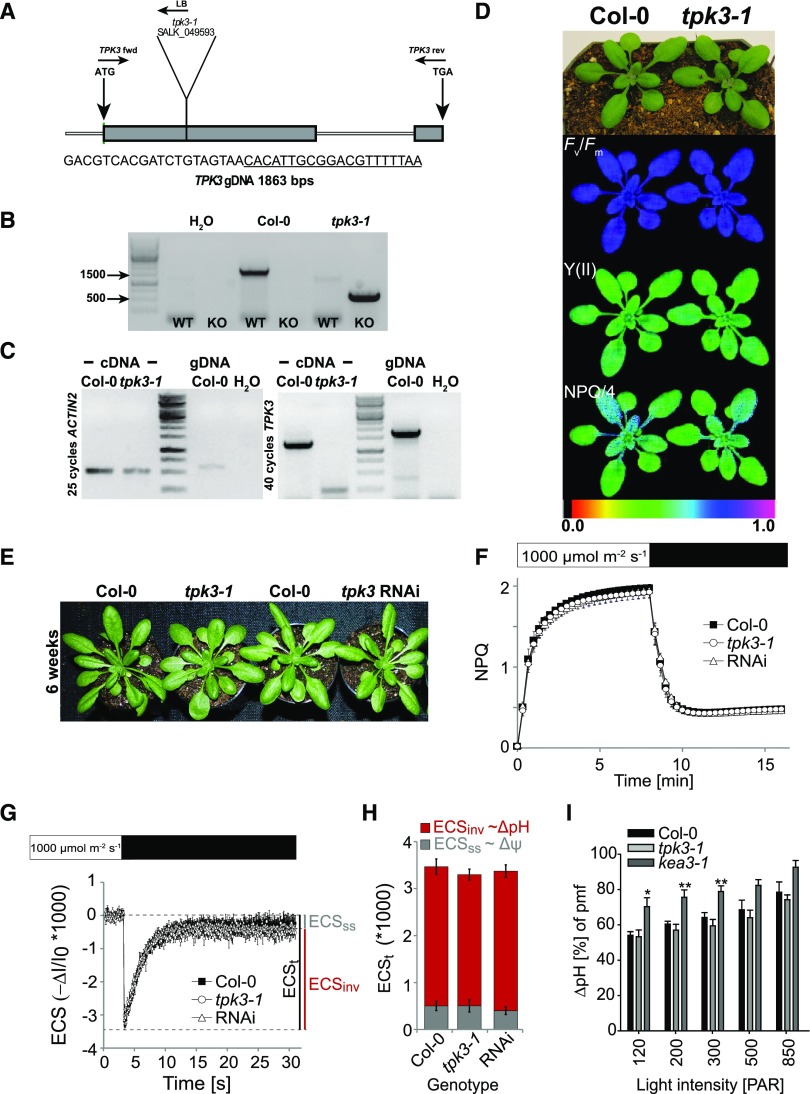
Figure 6.
tpk3-1 loss-of-function mutants and tpk3RNAi knock-down plants do not show a photosynthetic phenotype. A, Schematic representation of the T-DNA mutation in SALK_049593 inserted in the first exon of the TPK3 locus (the underlined sequence is the left border of the T-DNA). B, PCR on extracted genomic DNA showing homozygous TPK3 locus disruption in tpk3-1 individuals. C, Analysis of the TPK3 transcript level. Whereas ACTIN2 mRNA was detectable in both Col-0 and tpk3-1, TPK3 transcript was only found in the wild type after 40 PCR cycles. D, Truecolor and false color images of Col-0 and tpk3-1 of the photosynthetic parameters Fv/Fm, Y(II), and NPQ/4 grown in standard long-day conditions. E, No phenotypic alterations from Col-0 were found in tpk3RNAi and tpk3-1 loss-of-function lines when grown in the 12 h/12 h light/dark regime at 90 μmol photons m−2 s−1, as described in Carraretto et al. (2013). F to H, No differences between TPK3-deficient mutants and the wild type with respect to NPQ kinetics (F; means ± sd, n = 4), ECS relaxation after steady-state illumination (G), or pmf partitioning (H; means ± se, n ≥ 5). I, Increased pmf storage into ΔpH component was found upon light intensity ramping. Only kea3-1 plants had a significantly higher ΔpH component compared to that in Col-0 at 120, 200, and 300 μmol photons m−2 s−1 actinic light, as indicated with *P < 0.05 and **P < 0.01 using one-way ANOVA and the Holm-Sidak multiple comparisons test. The SE is based on n ≥ 8.

