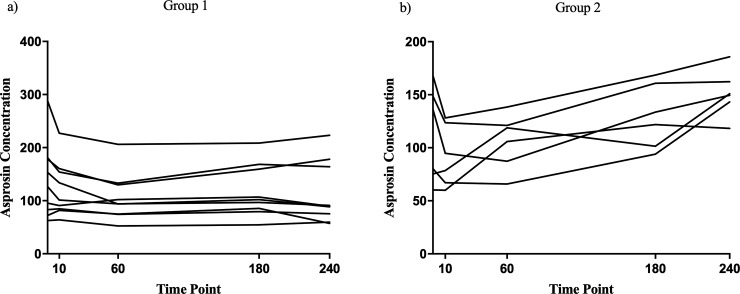
Fig 2. Individual asprosin concentrations.
Individual asprosin concentrations during the ivGTT and clamp study. X-Axis shows the time points in minutes. 0 = baseline before the ivGTT was started, median blood glucose level was 159 mg/dl. 10 = ten minutes after intravenous glucose injection, median blood glucose level was 267 mg/dl. 60 = 60 minutes after intravenous glucose injection, median blood glucose level was 227 mg/dl. 180 = during the hyperinsulinemic clamp at a median glucose level of 89 mg/dl in a steady state. 240 = during the hyperinsulinemic clamp at a median glucose level of 58 mg/dl in a steady state. There was no statistical difference between the absolute values of asprosin levels at the different time points. However, the delta values between baseline asprosin levels and asprosin levels during hypoglycemia were significantly different between the groups (p<0.001). Asprosin concentrations are given in nanograms per milliliter. (a) Individual asprosin concentrations of patients without increase in asprosin concentrations during initial blood glucose lowering or hypoglycaemia (group 1, n = 9). (b) Individual asprosin concentrations of patients with increase in asprosin concentrations during initial blood glucose lowering or hypoglycaemia (group 2, n = 6). ivGTT = intravenous glucose tolerance test. mg/dl = milligrams per deciliter.

