
Figure 2. Regulation of esophagus striated muscle patterning involves MET/HGF signaling.
(A–C) RT-qPCR analysis for Isl1 and Myf5 at E15.5 (A), E17.5 (B) and 3 weeks postnatal (C) in different esophagus portions and stomach as indicated in the schematic view (top, right). The low level of Isl1 expression in the posterior esophagus at fetal stages might reflect contamination from the stomach at the esophagus interface (n = 3 each condition). (D–E) RT-qPCR analysis for Isl1 and Met at E15.5, E17.5 and 3 weeks postnatal in Tg:Pax7-nGFP+ cells isolated by FACS from the masseter or esophagus. All data points are plotted and presented as the mean ± SEM (error bars) (n = 3 each condition). (F–H) Immunostainings on transverse cryosections of E16.5 control, MetD/D and Hgf-/- fetuses for Myod/Myog (myogenic progenitors) and SMA (smooth muscle actin). E-Cad labels the esophagus lumen epithelium. Higher magnifications are shown in (F’–H’) (n = 3 each condition). (I–K) Immunostainings on transverse cryosections of E16.5 control, MetD/D and Hgf-/- fetuses for Tnnt3 (myofiber marker) and E-Cad. Higher magnifications are shown in (I’–K’). Note the absence of ESM formation in both Met and Hgf mutants (n = 3 each condition). Scale bars: F, 100 µm; F’, 50 µm.

Figure 2—figure supplement 1. Met and Hgf expression along the developing esophagus.
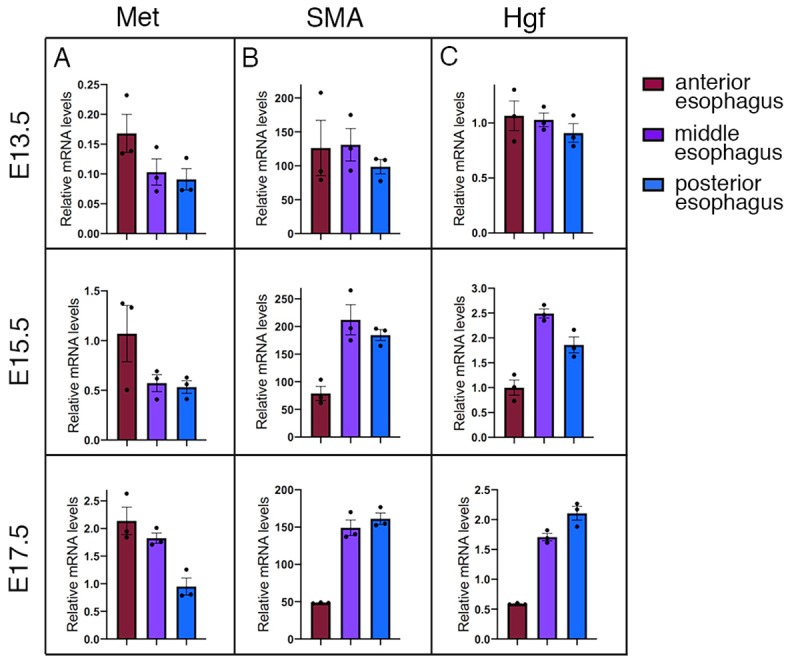
Figure 2—figure supplement 2. Phenotype of Met and Hgf mutants.
