. 2019 Sep 9;8:e48119. doi: 10.7554/eLife.48119

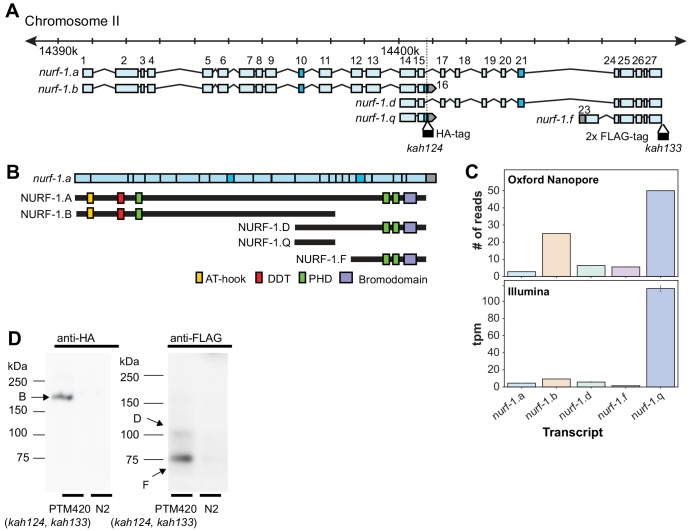
Figure 2. nurf-1 encodes five major transcripts.

(A) Genomic position of the five nurf-1 transcripts supported by Illumina short read and Oxford Nanopore long reads. Each blue box is an exon. Exon number is indicated on the figure. Dark blue exons (10, 16, and 21) are alternatively spliced, resulting in a 6–9 bp difference in length (see Figure 2—figure supplement 1 for details). Genomic location of the HA and FLAG epitope tag insertion site are shown in black along with their associated allele names. (B) The predicted protein isoforms produced by each of the five major transcripts and along with the domains each isoform contains. Immunoblots only supported translation of the B, D, and F isoforms (see panel D for details). For reference, the spliced nurf-1.a transcript is also shown. (C) Relative expression levels of each transcript, determined by number of Oxford Nanopore reads from a mixed population (top panel) or analysis of Illumina short reads from L2 staged animals using kallisto (bottom reads). tpm = transcripts per million. (D) Western blots of N2 and PTM420 strains. PTM420 contains the HA and FLAG epitope tags shown in panel A. Anti-HA antibody detected a band matching the expected size of the NURF-1.B isoform (arrow). Anti-FLAG antibody detected bands matching the expected size of the NURF-1.D and NURF-1.F isoforms (arrows).

Figure 2.

Figure 2—figure supplement 1. RNA-seq analysis of nurf-1.

Figure 2—figure supplement 1.

Coverage plot of reads from RNA. Note the high expression of the 14th, 15th, and 16th exons, supporting the existence of the nurf-1.q transcript. Reads covering the 23rd exon were also observed, supporting the expression of the nurf-1.f transcript. Zoomed in view of the 10th, 16th, and 21 st exons indicates alternative splicing sites are used at these exons. Clipped reads containing sl1 sequence support transcriptional start sites at the 1 st and 14th exon.
Figure 2—figure supplement 1—source data 1. Source data for Figure 2—figure supplement 1.
DOI: 10.7554/eLife.48119.010
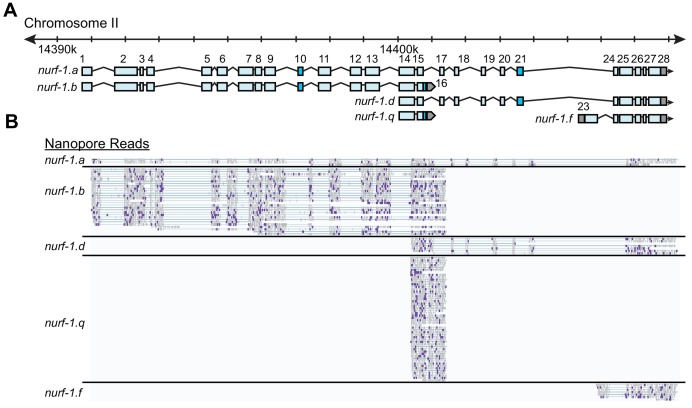
Figure 2—figure supplement 2. nurf-1 encodes multiple transcripts.

Figure 2—figure supplement 2.

(A) Subset of nurf-1 transcripts analyzed in this paper. Each blue box is an exon. Exon number is indicated on the figure. Dark blue exons are alternatively spliced, resulting in a 6–9 bp difference in length. (B) Nanopore sequencing reads aligned to nurf-1. Reads were grouped by the nurf-1 transcripts they support. Dark purple marks are mismatches from the reference sequence.
Figure 2—figure supplement 2—source data 1. Source data for Figure 2—figure supplement 2.
DOI: 10.7554/eLife.48119.012
Figure 2—figure supplement 3. Relative expression levels of each nurf-1 transcript, determined by analysis of Illumina short reads using kallisto (bottom reads).
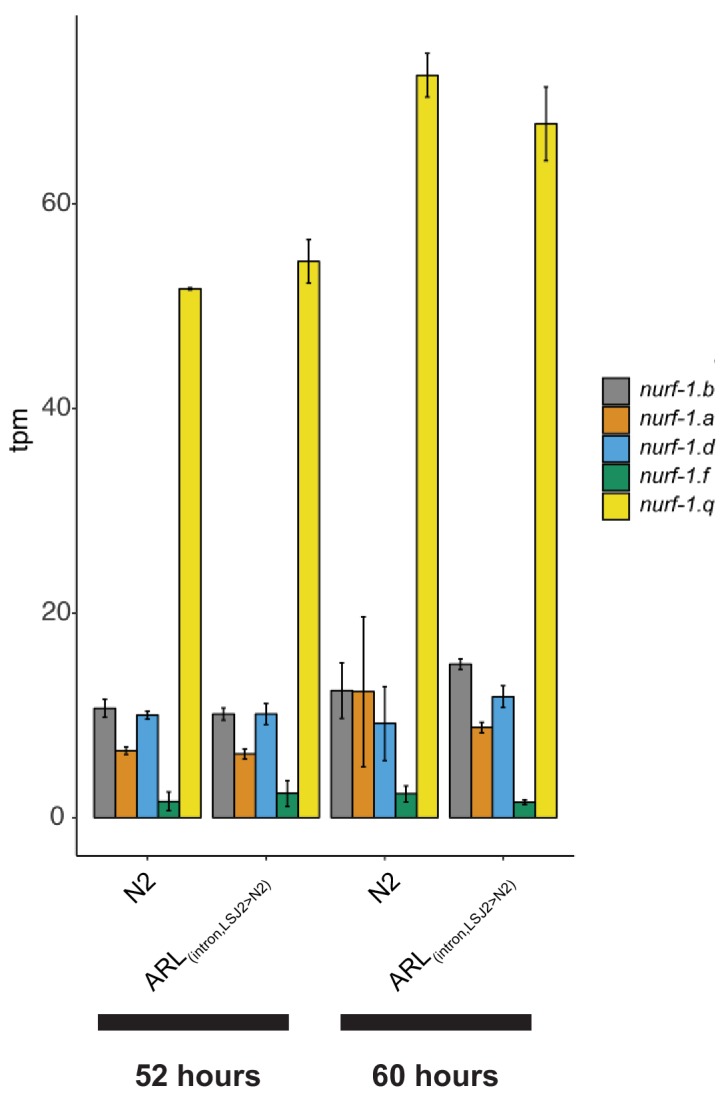
Figure 2—figure supplement 3.

Strains and timepoints (relative to the L1 stage) are indicated on the x-axis. No significant difference in transcript levels was observed between the N2 and ARL(intron, LSJ2>N2) strains.
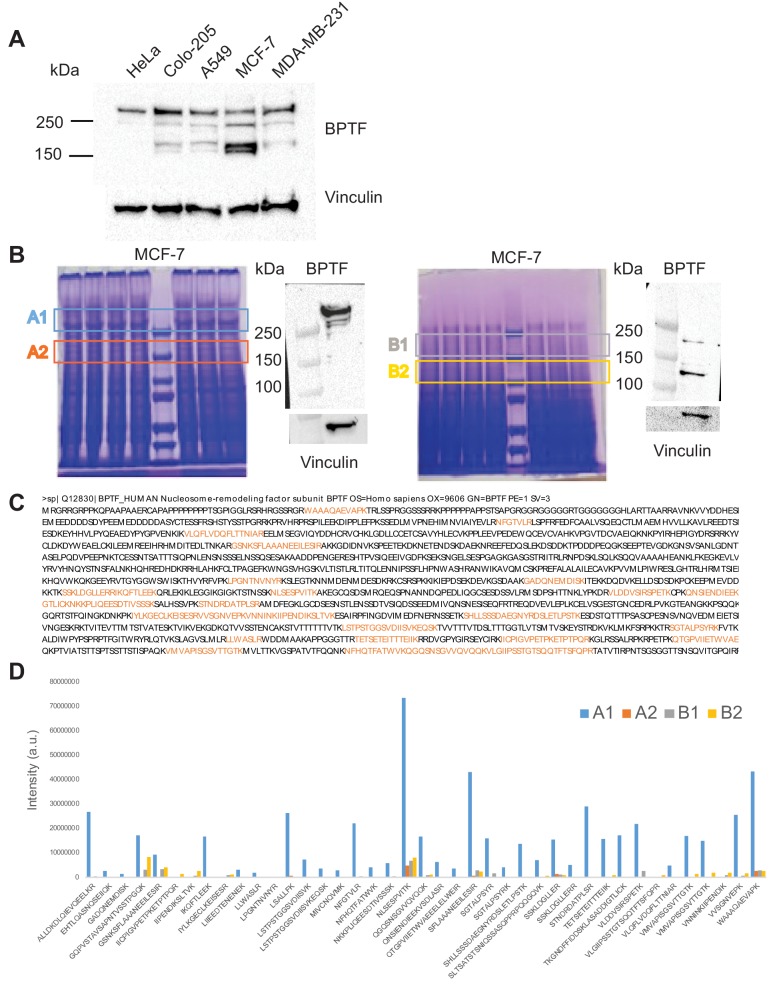
Figure 2—figure supplement 4. Identification of alternative BPTF species in human cancer cells.

Figure 2—figure supplement 4.

(A) Reactivity of anti-BPTF antibodies with lysates from human cancer cells. Cell line-specific patterns were observed, with bands of the same mobility being detected across lines and detected with independent antibodies. The findings suggest the occurrence of multiple BPTF-related protein species in human cancer cells. A representative western blot is shown. (B) Gel bands selected for BPTF Mass Spectrometry identification according to the localization of the BPTF signal detected by western blotting in MCF-7 cells. (Left, NP-40 lysis buffer, gel bands A1 and A2; Right, Laemmli buffer, B1 and B2). The detection of low molecular weight species upon direct cell lysis in Laemmli buffer strongly supports the notion that the findings do not result from artifactual proteolysis. (C) Sequence coverage of BPTF protein. Peptides identified by LC-MS/MS are highlighted in color. (D) BPTF peptide intensity (arbitrary units) calculated by MaxQuant in the gel bands A1, A2/B1, B2.